. 2004;3(5):21.
doi: 10.1186/jbiol16. Epub 2004 Dec 6.

The functional landscape of mouse gene expression

Affiliations

The functional landscape of mouse gene expression

Wen Zhang et al. J Biol. 2004.

Abstract

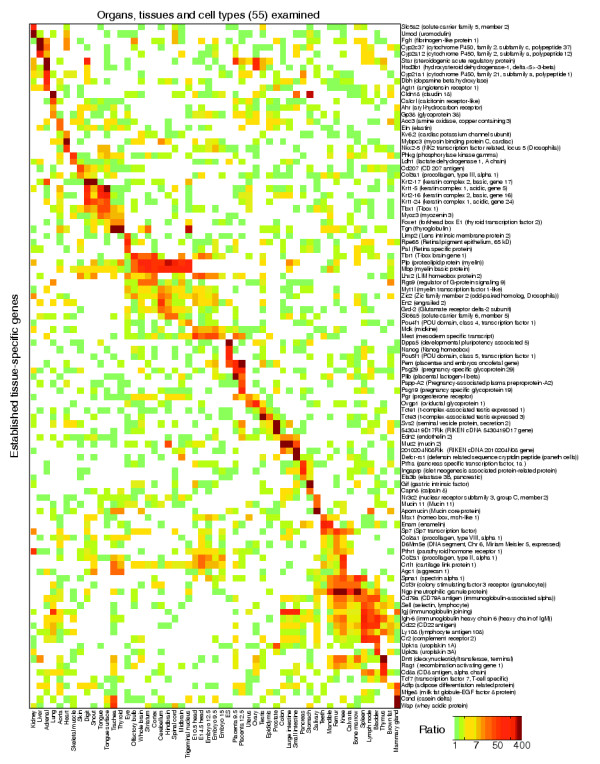
Background: Large-scale quantitative analysis of transcriptional co-expression has been used to dissect regulatory networks and to predict the functions of new genes discovered by genome sequencing in model organisms such as yeast. Although the idea that tissue-specific expression is indicative of gene function in mammals is widely accepted, it has not been objectively tested nor compared with the related but distinct strategy of correlating gene co-expression as a means to predict gene function.

Results: We generated microarray expression data for nearly 40,000 known and predicted mRNAs in 55 mouse tissues, using custom-built oligonucleotide arrays. We show that quantitative transcriptional co-expression is a powerful predictor of gene function. Hundreds of functional categories, as defined by Gene Ontology 'Biological Processes', are associated with characteristic expression patterns across all tissues, including categories that bear no overt relationship to the tissue of origin. In contrast, simple tissue-specific restriction of expression is a poor predictor of which genes are in which functional categories. As an example, the highly conserved mouse gene PWP1 is widely expressed across different tissues but is co-expressed with many RNA-processing genes; we show that the uncharacterized yeast homolog of PWP1 is required for rRNA biogenesis.

Conclusions: We conclude that 'functional genomics' strategies based on quantitative transcriptional co-expression will be as fruitful in mammals as they have been in simpler organisms, and that transcriptional control of mammalian physiology is more modular than is generally appreciated. Our data and analyses provide a public resource for mammalian functional genomics.


Figures

Figure 1
Figure 1
Expression of previously characterized tissue-specific genes. Genes were identified manually by searching MEDLINE abstracts [66] and XM sequence description fields (see Additional data file 1) for keywords corresponding to the appropriate tissues. Rows and columns were ordered manually.
Figure 2
Figure 2
Validation of expression data by independent confirmation. (a) The P value of Spearman's Rank correlations (see Materials and methods) is shown for all possible comparisons among the 13 tissues common to all three studies (ours and those by Su et al. [15] and Bono et al. [17]) and 1,109 genes for which the same isoform is unambiguously represented on the arrays used in each of the studies (see Materials and methods). (b) Microarray data and RT-PCR results for 47 known and predicted XM genes are shown. Genes were selected to represent primarily those without GO Biological Processes (GO-BP) assignment and to encompass expression in all 18 tissues, and were biased towards those with functions predicted by support vector machines (SVMs) in categories of interest (or expressed in tissues of interest). The three columns on the far right show whether each XM gene was uncharacterized (not annotated) in GO-BP, and whether it is represented by a cDNA or EST.
Figure 3
Figure 3
Defining whether a gene is expressed, and how many genes are detected as expressed per sample. (a) The curves show the cumulative distribution for negative-control probes (cyan line) and for probes on the array (blue line), over all arrays, to illustrate how genes were defined as expressed. The dotted black line indicates the 99thpercentile for the negative control spots. (b) The number of genes expressed in any given number of tissues (between 1 tissue and 55 tissues; for example, there are 4,475 genes detected in only one sample, 171 genes expressed in exactly 27 samples, 1,790 genes detected in all 55 samples, and so on). The genes expressed in each of the 55 tissues were determined as in (a). (c) Number of genes defined as expressed in each of the 55 tissues, using criteria in (a).
Figure 4
Figure 4
Correspondence between gene expression patterns and GO-BP annotations. (a) Ratios for the 21,622 expressed genes were grouped by two-dimensional hierarchical agglomerative clustering and diagonalization, using the Pearson correlation coefficient. (b) Negative logs of P values resulting from applying the Wilcoxon-Mann-Whitney (WMW) test to each of the GO-BP categories in each of the tissues are shown. The categories (vertical axis) were clustered and ordered as in (a). (c, d) 'Density' of GO-BP annotations significantly enriched in specific points along the vertical axis at left (genes) are indicated; note that genes are in the same order in (a, b, c).
Figure 5
Figure 5
Expression of genes in 17 different functional categories. The categories were ordered manually. The genes within each category were clustered separately from those in other categories. The order of tissues is preserved from previous figures.
Figure 6
Figure 6
Predicting GO-BP categories of mouse genes using microarray data and SVMs. (a) The number of the 992 initial GO-BP categories exceeding the indicated precision value, with recall fixed for each line; for example at 40% recall (green line), around 100 categories achieve precision of 30%. To estimate the significance of the colored lines, we repeated their calculation after permuting the gene labels in the annotation database. The dotted gray line indicates the maximum number of GO categories that achieve the indicated precision, with recall of 10% or greater. The dotted magenta line indicates the result obtained using 'binary' expression data (expressed/not expressed) in each tissue. (b) The number of genes with predicted GO-BP categories (blue line) or superGO categories (red line) at varying precision values. The individual predictions are given in the Additional data files. (c) Comparison of the overall predictive capacity of three data sets, restricted to the 13 tissues and 1,800 genes shared by all three data sets. Each of the lines corresponds to the 30% recall line in (a). All of the lines are to the lower right of those in (a), since fewer genes and tissues were used. (d) A histogram comparing the precision of predictions derived from lists of tissue-specific genes with the precision of predictions from SVMs. For each category, the tissue-specific list yielding the highest precision value was identified, along with its associated recall value, and the SVM precision for the same category at the same recall value was identified. The difference between the two precision values is plotted for each category, such that instances where the SVM is superior are to the right of center.
Figure 7
Figure 7
Expression patterns of 1,092 unannotated genes predicted to belong to any of 117 'superGO' categories with 50% confidence or higher. The vertical axis was clustered and diagonalized as in Figure 4. The height of each predicted category has been normalized to facilitate display; the number of genes predicted in each category is indicated at the left. The gene order (vertical axis) has been clustered within each category to illustrate that some categories are characterized by multiple patterns. The proportion (%) of predicted genes in each category that have gene-trap ES cell lines available are represented at right (color scale from 0 to 100%).
Figure 8
Figure 8
PWP1 functions in ribosomal large-subunit biogenesis. (a) The expression pattern of mouse Pwp1 is similar to that of most known RNA-processing proteins. (b) The domain structures of Pwp1 homologs identified by BLASTP searches. Accession number and amino-acid length is given. We identified a single strong match in each of the species shown. Domains were identified by CDD search [29]. (c) A northern blot showing the accumulation of 35S rRNA precursor (blue arrow), reduction in other rRNA precursors (top panel), and reduction in 25S rRNA (red arrow) in the yeast TetO7-PWP1 mutant (strain TH_2220) in comparison to the parental wild-type strain (R1158) [9]. The U2 spliceosomal RNA is shown for comparison; its apparent abundance is increased because 5 μg RNA was loaded per lane, and the relative proportion of rRNA to snRNA is decreased in the mutant. Blotting procedures and probes were as previously described [9]. (d) Affinity-purification of yeast Pwp1p-TAP reveals association with proteins known to function in ribosomal large-subunit biogenesis (Ebp2p, Nop12p, Brx1p) as well as a subset of ribosomal proteins. The asterisks mark degradation products of Pwp1p-TAP.

Comment in

References

    1. Eisen MB, Spellman PT, Brown PO, Botstein D. Cluster analysis and display of genome-wide expression patterns. Proc Natl Acad Sci USA. 1998;95:14863–14868. doi: 10.1073/pnas.95.25.14863. - DOI - PMC - PubMed
    1. Niehrs C, Pollet N. Synexpression groups in eukaryotes. Nature. 1999;402:483–487. doi: 10.1038/990025. - DOI - PubMed
    1. Hughes TR, Marton MJ, Jones AR, Roberts CJ, Stoughton R, Armour CD, Bennett HA, Coffey E, Dai H, He YD, et al. Functional discovery via a compendium of expression profiles. Cell. 2000;102:109–126. doi: 10.1016/S0092-8674(00)00015-5. - DOI - PubMed
    1. Kim SK, Lund J, Kiraly M, Duke K, Jiang M, Stuart JM, Eizinger A, Wylie BN, Davidson GS. A gene expression map for Caenorhabditis elegans. Science. 2001;293:2087–2092. doi: 10.1126/science.1061603. - DOI - PubMed
    1. Wu LF, Hughes TR, Davierwala AP, Robinson MD, Stoughton R, Altschuler SJ. Large-scale prediction of Saccharomyces cerevisiae gene function using overlapping transcriptional clusters. Nat Genet. 2002;31:255–265. doi: 10.1038/ng906. - DOI - PubMed

Publication types