

Screening large-scale association study data: exploiting interactions using random forests
- PMID: 15588316
- PMCID: PMC545646
- DOI: 10.1186/1471-2156-5-32
Screening large-scale association study data: exploiting interactions using random forests
Abstract
Background: Genome-wide association studies for complex diseases will produce genotypes on hundreds of thousands of single nucleotide polymorphisms (SNPs). A logical first approach to dealing with massive numbers of SNPs is to use some test to screen the SNPs, retaining only those that meet some criterion for further study. For example, SNPs can be ranked by p-value, and those with the lowest p-values retained. When SNPs have large interaction effects but small marginal effects in a population, they are unlikely to be retained when univariate tests are used for screening. However, model-based screens that pre-specify interactions are impractical for data sets with thousands of SNPs. Random forest analysis is an alternative method that produces a single measure of importance for each predictor variable that takes into account interactions among variables without requiring model specification. Interactions increase the importance for the individual interacting variables, making them more likely to be given high importance relative to other variables. We test the performance of random forests as a screening procedure to identify small numbers of risk-associated SNPs from among large numbers of unassociated SNPs using complex disease models with up to 32 loci, incorporating both genetic heterogeneity and multi-locus interaction.
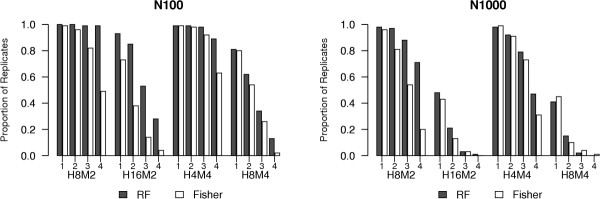
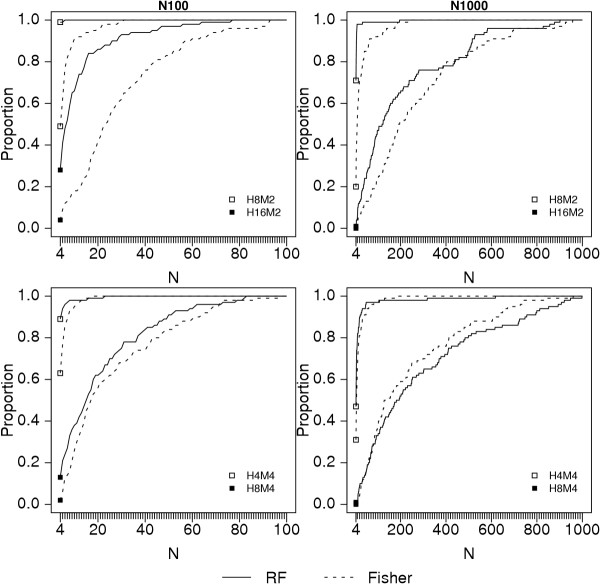
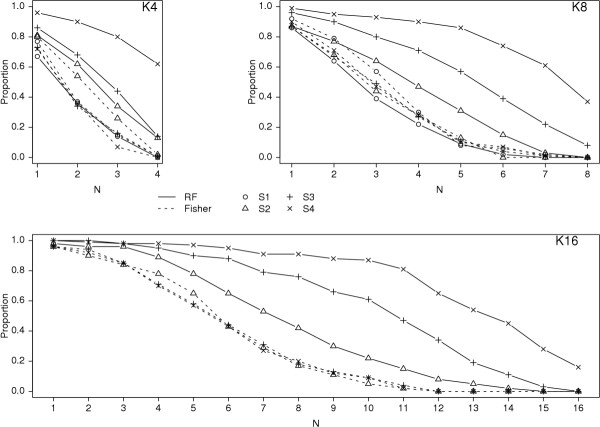
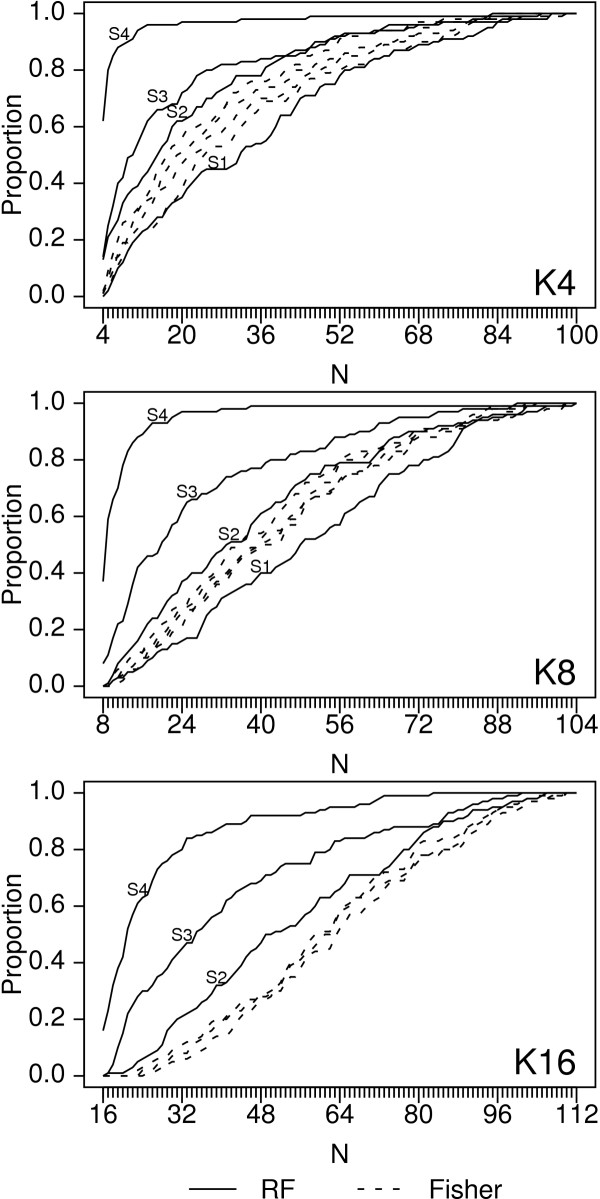
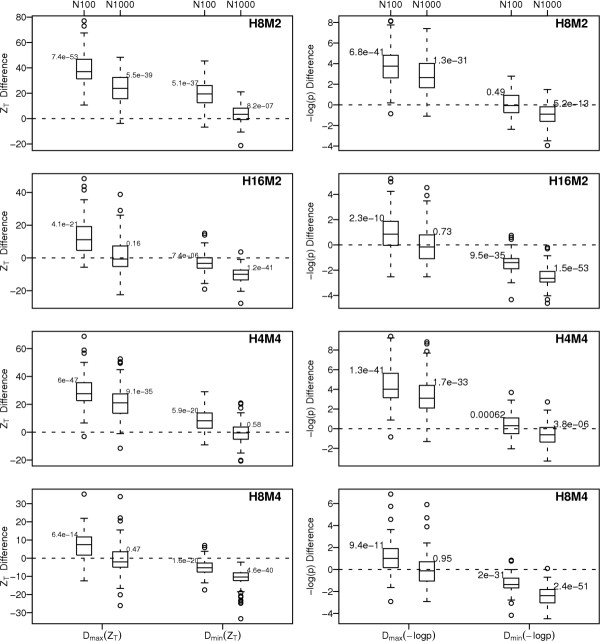
Results: Keeping other factors constant, if risk SNPs interact, the random forest importance measure significantly outperforms the Fisher Exact test as a screening tool. As the number of interacting SNPs increases, the improvement in performance of random forest analysis relative to Fisher Exact test for screening also increases. Random forests perform similarly to the univariate Fisher Exact test as a screening tool when SNPs in the analysis do not interact.
Conclusions: In the context of large-scale genetic association studies where unknown interactions exist among true risk-associated SNPs or SNPs and environmental covariates, screening SNPs using random forest analyses can significantly reduce the number of SNPs that need to be retained for further study compared to standard univariate screening methods.
Figures
References
-
- George EI, McCulloch RE. Variable Selection via Gibbs Sampling. Journal of the American Statistical Association. 1993;88:881–889.
-
- York TP, Eaves LJ. Common disease analysis using Multivariate Adaptive Regression Splines (MARS): Genetic Analysis Workshop 12 simulated sequence data. Genet Epidemiol. 2001;21 Suppl 1:S649–54. - PubMed
MeSH terms
LinkOut - more resources
Full Text Sources
Other Literature Sources
Medical
