

Proportional odds ratio model for comparison of diagnostic tests in meta-analysis
- PMID: 15588327
- PMCID: PMC539279
- DOI: 10.1186/1471-2288-4-27
Proportional odds ratio model for comparison of diagnostic tests in meta-analysis
Abstract
Background: Consider a meta-analysis where a 'head-to-head' comparison of diagnostic tests for a disease of interest is intended. Assume there are two or more tests available for the disease, where each test has been studied in one or more papers. Some of the papers may have studied more than one test, hence the results are not independent. Also the collection of tests studied may change from one paper to the other, hence incomplete matched groups.
Methods: We propose a model, the proportional odds ratio (POR) model, which makes no assumptions about the shape of ORp, a baseline function capturing the way OR changes across papers. The POR model does not assume homogeneity of ORs, but merely specifies a relationship between the ORs of the two tests. One may expand the domain of the POR model to cover dependent studies, multiple outcomes, multiple thresholds, multi-category or continuous tests, and individual-level data.
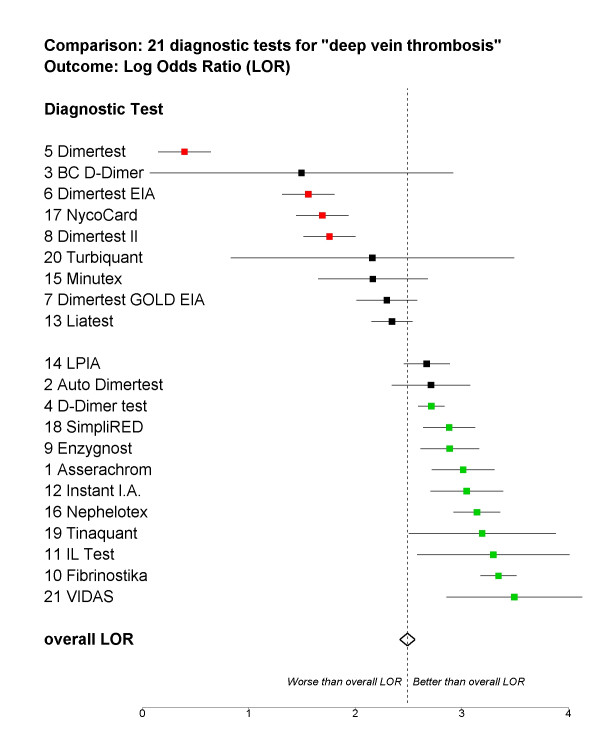
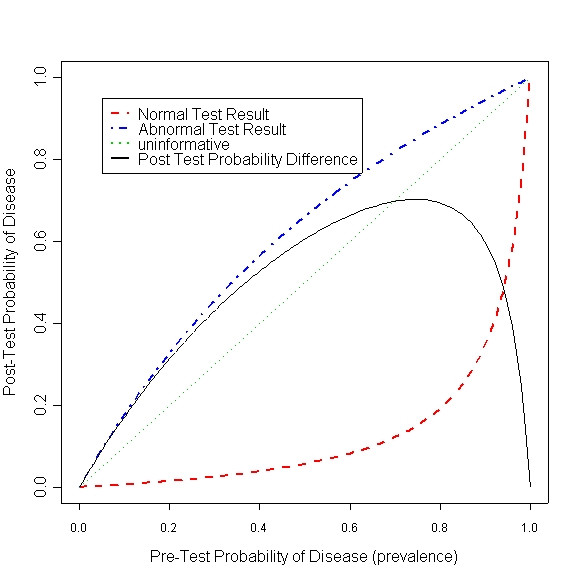
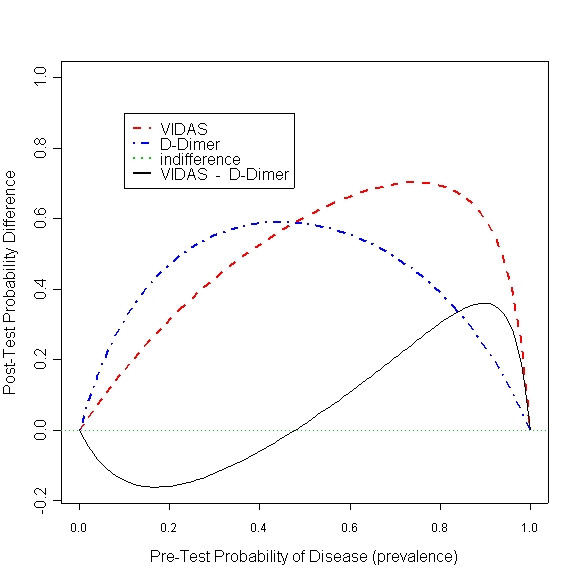
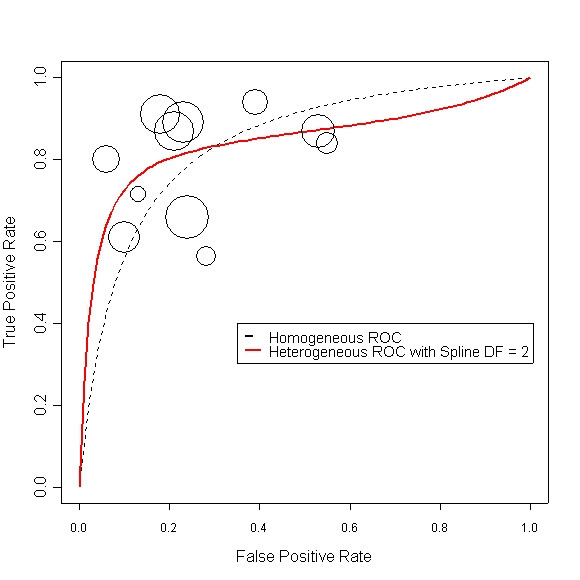
Results: In the paper we demonstrate how to formulate the model for a few real examples, and how to use widely available or popular statistical software (like SAS, R or S-Plus, and Stata) to fit the models, and estimate the discrimination accuracy of tests. Furthermore, we provide code for converting ORs into other measures of test performance like predictive values, post-test probabilities, and likelihood ratios, under mild conditions. Also we provide code to convert numerical results into graphical ones, like forest plots, heterogeneous ROC curves, and post test probability difference graphs.
Conclusions: The flexibility of POR model, coupled with ease with which it can be estimated in familiar software, suits the daily practice of meta-analysis and improves clinical decision-making.
Figures
References
-
- L'Abbe KA, Detsky AS, O'Rourke K. Meta-analysis in clinical research. Ann Intern Med. 1987;107:224–33. - PubMed
-
- Dorfman DD, Berbaum KS, Metz CE. Receiver operating characteristic rating analysis. Invest Radiol. 1992;27:723–731. - PubMed
-
- Irwig L, Tosteson ANA, Gatsonis C, Lau J, Colditz G, Chalmers TC, Mosteller F. Guidelines for meta-analyses evaluating diagnostic tests. Ann Intern Med. 1994;120:667–676. - PubMed
-
- Rutter CM, Gatsonis CA. Regression methods for meta-analysis of diagnostic test data. Acad Radiol. 1995;2:S48–S56. - PubMed
-
- Nelson TO. ROC curves and measures of discrimination accuracy: A reply to Swets. Psychol Bull. 1986;99:128–132. - PubMed
Publication types
MeSH terms
LinkOut - more resources
Full Text Sources
