. 2004 May;1(4):274-86.
doi: 10.1186/1479-7364-1-4-274.

The genomic distribution of population substructure in four populations using 8,525 autosomal SNPs

Affiliations

The genomic distribution of population substructure in four populations using 8,525 autosomal SNPs

Mark D Shriver et al. Hum Genomics. 2004 May.

Abstract

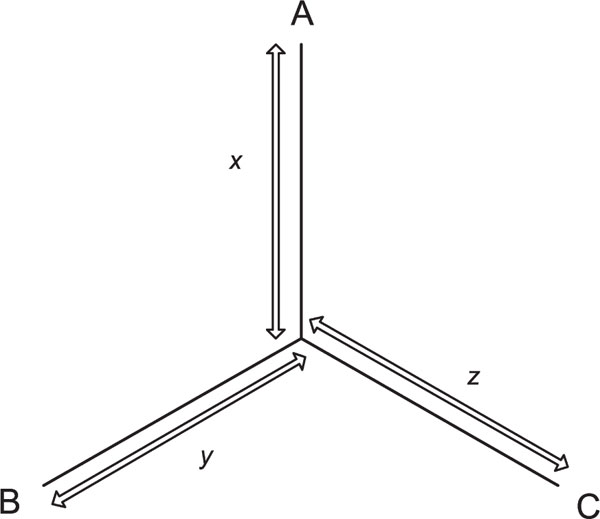
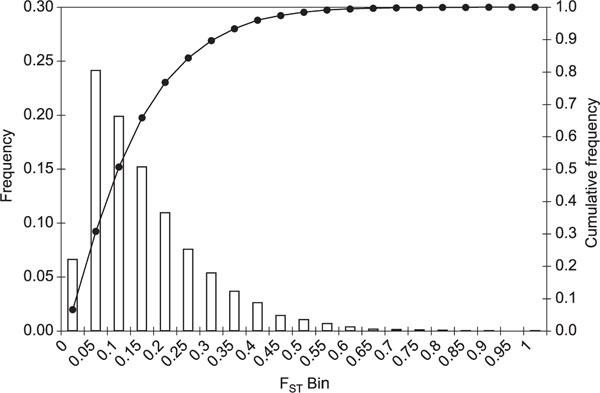
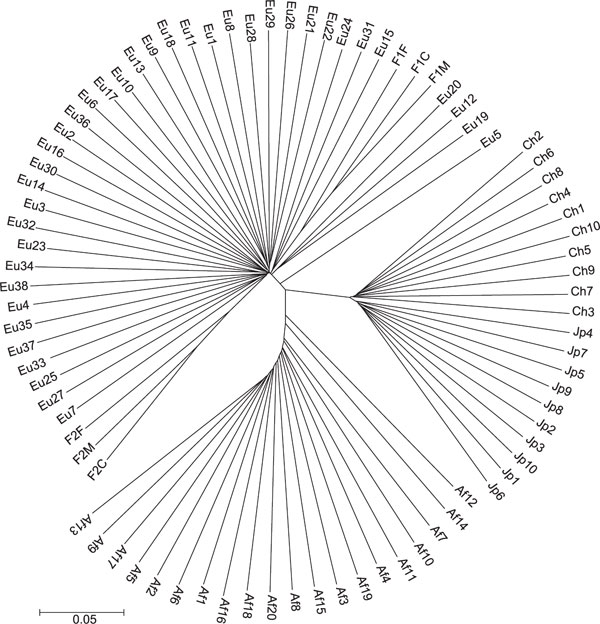
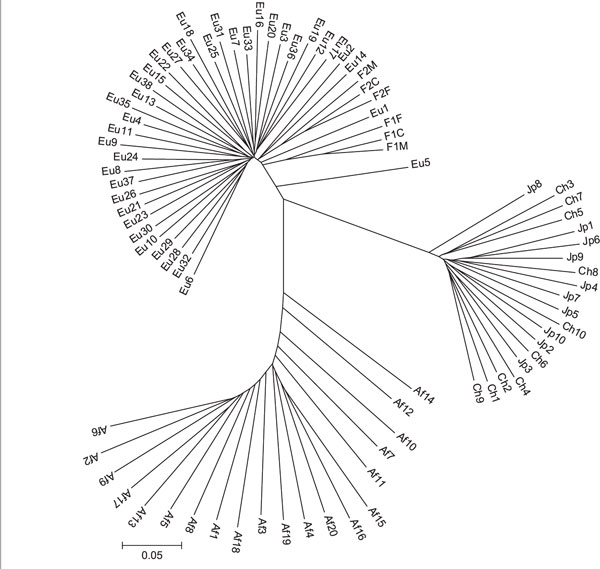
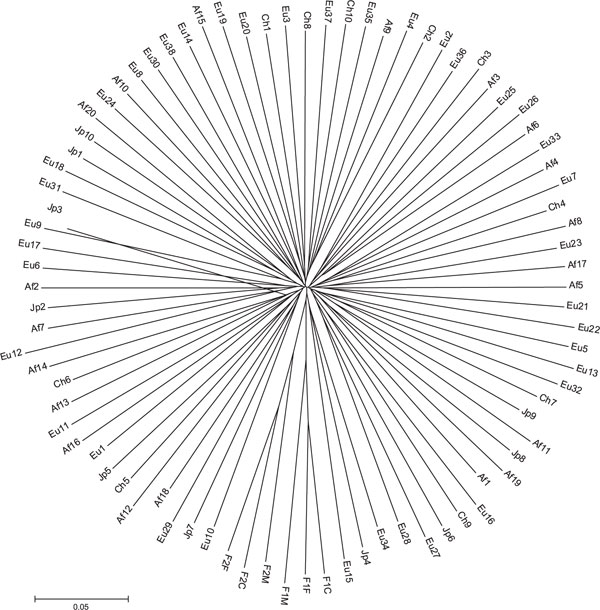
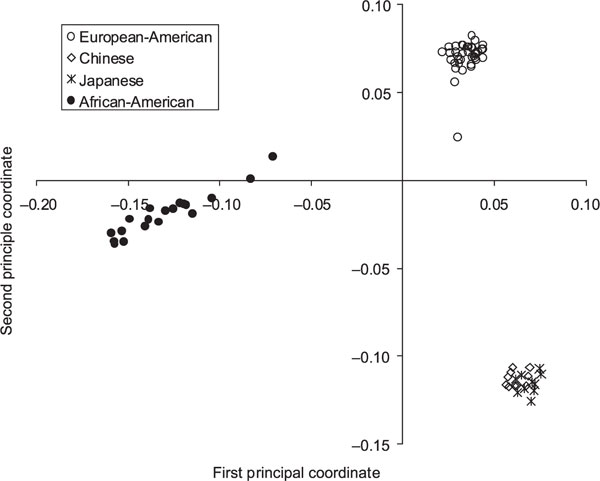
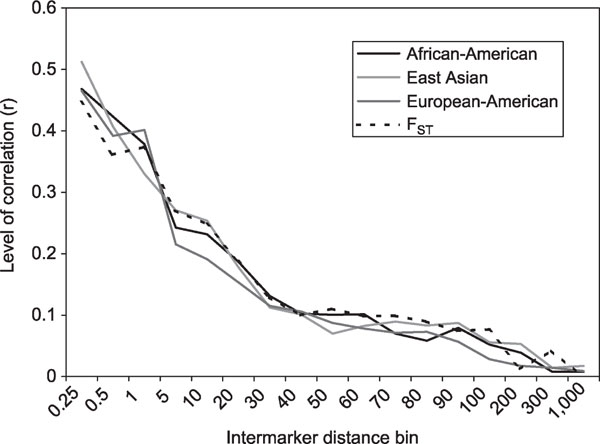
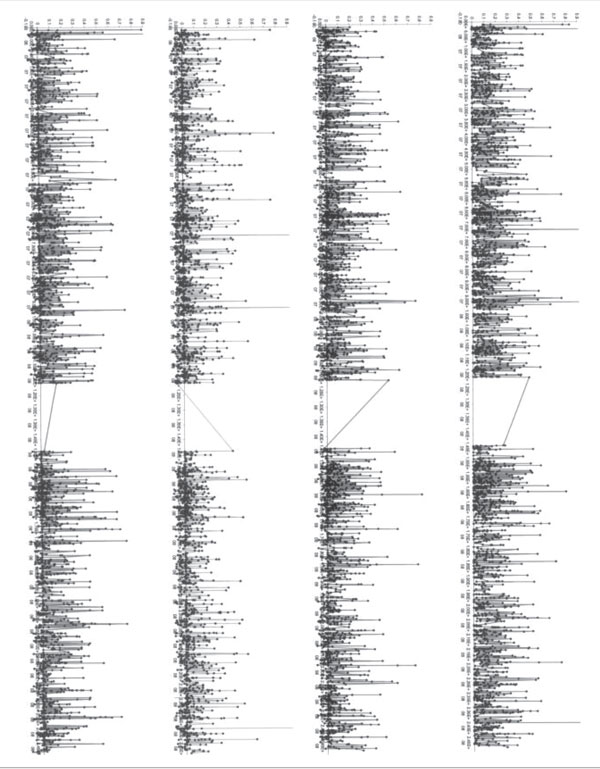
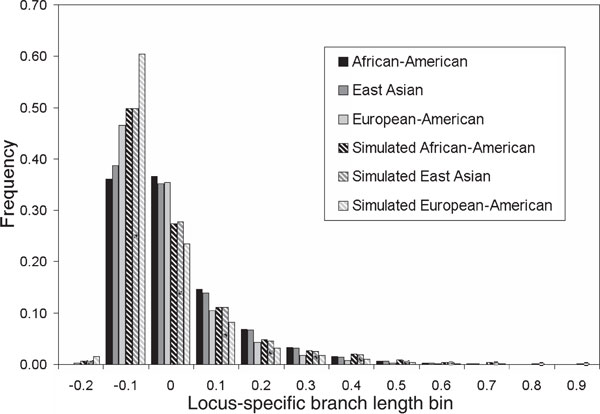
Understanding the nature of evolutionary relationships among persons and populations is important for the efficient application of genome science to biomedical research. We have analysed 8,525 autosomal single nucleotide polymorphisms (SNPs) in 84 individuals from four populations: African-American, European-American, Chinese and Japanese. Individual relationships were reconstructed using the allele sharing distance and the neighbour-joining tree making method. Trees show clear clustering according to population, with the root branching from the African-American clade. The African-American cluster is much less star-like than European-American and East Asian clusters, primarily because of admixture. Furthermore, on the East Asian branch, all ten Chinese individuals cluster together and all ten Japanese individuals cluster together. Using positional information, we demonstrate strong correlations between inter-marker distance and both locus-specific FST (the proportion of total variation due to differentiation) levels and branch lengths. Chromosomal maps of the distribution of locus-specific branch lengths were constructed by combining these data with other published SNP markers (total of 33,704 SNPs). These maps clearly illustrate a non-uniform distribution of human genetic substructure, an instructional and useful paradigm for education and research.


Figures

Figure 1
Figure 1
Diagram demonstrating how branch lengths are estimated for a network with three populations. Locus-specific branch lengths x, y and z, are calculated using pairwise FST distances, dAB, dBC and dAC, wher x = (dAB + dAC - dAB)/2, y = (dAB +dBC - dAC)/2, z = (dAC + dBC - dAB)/2 and A, B and C are the three populations under consideration.
Figure 2
Figure 2
Distribution of FST. FST was calculated using Weir and Cockerham's unbiased estimator (1984) [17]. The histogram shows bin distribution, as indicated on the x-axis, and the cumulative distribution, represented by a line.
Figure 3A
Figure 3A
Relationships among individuals were reconstructed using the neighbour-joining method on a matrix of allele sharing distances (ASDs). Unrelated individuals from four populations are shown: African-American (labelled AfX; n = 20); European-American (labelled EuX; n = 38; Japanese (labelled JpX; n = 10); and Chinese (labelled ChX; n = 10), along with two nuclear family trios (mother, father and child, labelled FXM, FXF and FXC, respectively). This figure shows phylogeny constructed using all 8,525 autosomal single nucleotide polymorphisms. Figure 3B shows phylogeny constructed using the 1,000 highest FST markers. Figure 3C shows the tree of individuals constructed using the 1,000 lowest FST markers. It is notable that the family relationships are still evident in the two trios when using markers like these, which clearly contain no information regarding population differences.
Figure 3B
Figure 3B
Tree of individuals constructed using the 1,000 highest FST markers.
Figure 3C
Figure 3C
Tree of individuals constructed using the 1,000 latest FST markers.
Figure 4
Figure 4
A principal coordinates analysis representation of the allele sharing distance. Populations included are indicated by the symbols listed in the key. Note that subject Eu5 is the open circle spaced away from the primary cluster of European-Americans.
Figure 5
Figure 5
Levels of correlation between autosomal single nucleotide polymorphism loci as a function of inter-marker distance. Inter-marker distance bin, labelled by upper bin cutoff in kilobases, is shown on the x-axis. Markers, ranked by chromosomal position and then individually compared with markers further down on the same chromosome, were placed in the appropriate bin based on inter-marker distance. All markers in each bin were used to calculate the correlation between the FST level for adjacent markers.
Figure 6
Figure 6
(see page 281). Chromosomal distribution of locus-specific branch length and FST for 3,258 markers localised to chromo-some 1. The top panel (A) shows the full FST, African-American locus specific branch length (LSBL) in the second panel (B), European-American LSBL in the third panel (C) and East Asian LSBL in the fourth panel (D). The value for each SNP is indicated with a black point and lines are drawn connecting adjacent points. Note that higher resolution colour plots for each chromosome are included in the Online Supplementary material (www.anthro.psu.edu/biolab).
Figure 7
Figure 7
Distribution of locus-specific branch length (LSBL) levels for real data and coalescent simulations. Shown are the histogram distributions of the LSBL levels for the three main population groups. East Asian (Japanese and Chinese) are shown in dark grey, European-American in light grey and African-American in black. Coalescent simulations conditioned on the average LSBL are shown as striped bars of the same shades.

References

    1. Risch N, Burchard E, Ziv E. et al.'Categorization of humans in biomedical research: Genes, race and disease'. Genome Biol. 2002;3:1–12. - PMC - PubMed
    1. Schork N, Fallin D, Tiwari HK, In: Handbook of Statistical Genetics. Balding, D., Bishop, M. and Cannings, C, editor. John Wiley and Sons, Hoboken, NJ; 2001. 'Pharmacogenetics'; pp. 741–764.
    1. Burroughs VJ, Maxey RW, Levy RA. 'Racial and ethnic differences in response to medicines: Towards individualized pharmaceutical treatment'. J Natl Med Assoc. 2002;94:1–26. - PMC - PubMed
    1. Bowcock AM, Ruiz-Linares A, Tomfohrde J. et al.'High resolution of human evolutionary trees with polymorphic microsatellites'. Natur. 1994;368:455–457. doi: 10.1038/368455a0. - DOI - PubMed
    1. Rosenberg NA, Pritchard JK, Weber JL. et al.'Genetic structure of human populations'. Science. 2002;298:2381–2385. doi: 10.1126/science.1078311. - DOI - PubMed

Publication types

LinkOut - more resources