. 2004 May;1(4):287-99.
doi: 10.1186/1479-7364-1-4-287.

Whole genome DNA copy number changes identified by high density oligonucleotide arrays

Affiliations

Whole genome DNA copy number changes identified by high density oligonucleotide arrays

Jing Huang et al. Hum Genomics. 2004 May.

Abstract

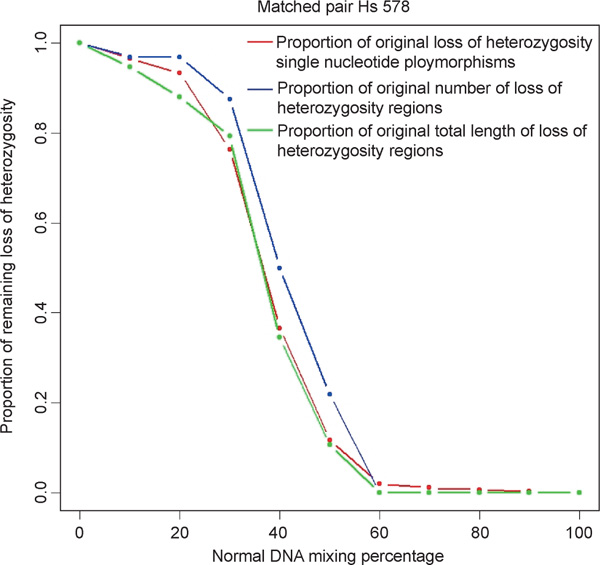
Changes in DNA copy number are one of the hallmarks of the genetic instability common to most human cancers. Previous microarray-based methods have been used to identify chromosomal gains and losses; however, they are unable to genotype alleles at the level of single nucleotide polymorphisms (SNPs). Here we describe a novel algorithm that uses a recently developed high-density oligonucleotide array-based SNP genotyping method, whole genome sampling analysis (WGSA), to identify genome-wide chromosomal gains and losses at high resolution. WGSA simultaneously genotypes over 10,000 SNPs by allele-specific hybridisation to perfect match (PM) and mismatch (MM) probes synthesised on a single array. The copy number algorithm jointly uses PM intensity and discrimination ratios between paired PM and MM intensity values to identify and estimate genetic copy number changes. Values from an experimental sample are compared with SNP-specific distributions derived from a reference set containing over 100 normal individuals to gain statistical power. Genomic regions with statistically significant copy number changes can be identified using both single point analysis and contiguous point analysis of SNP intensities. We identified multiple regions of amplification and deletion using a panel of human breast cancer cell lines. We verified these results using an independent method based on quantitative polymerase chain reaction and found that our approach is both sensitive and specific and can tolerate samples which contain a mixture of both tumour and normal DNA. In addition, by using known allele frequencies from the reference set, statistically significant genomic intervals can be identified containing contiguous stretches of homozygous markers, potentially allowing the detection of regions undergoing loss of heterozygosity (LOH) without the need for a matched normal control sample. The coupling of LOH analysis, via SNP genotyping, with copy number estimations using a single array provides additional insight into the structure of genomic alterations. With mean and median inter-SNP euchromatin distances of 244 kilobases (kb) and 119 kb, respectively, this method affords a resolution that is not easily achievable with non-oligonucleotide-based experimental approaches.


Figures

Figure 1
Figure 1
Plot of the standardised log intensity of 1X, 3X, 4X and 5X against 2X. The signal intensities are based on the average of two replicates across 302 single nucleotide polymorphisms that map to the X chromosome using National Center for Biotechnology Information Build 33. Figure 1b plots log (copy number) as a function of estimated log (intensity ratio) (C). The black dots indicate different samples (1X to 5X). The red line is the linear regression result using log (copy number) as the response and estimated log intensity ratio as the predictor. The blue lines indicate the 95 per cent confidence interval for the response, ie the natural log of the copy number.
Figure 2
Figure 2
The results for 99 autosomal single nucleotide polymorphisms using the SK-BR-3 breast cancer cell line. The pairwise scatter-plots are based on three measurements: copy number, significance and the change in threshold cycle (Δ Ct). The significance measure is represented by the log 10 transformed p-value derived from the algorithm. To distinguish between deletions and amplifications, the -log10 (p -value) is used when the target value is higher than the reference mean, ie denoting amplification, and the log10 (p -value) is used when the target value is lower than the reference mean, ie denoting deletion. Copy number is estimated using the following formula: Copynumberexp(0.659+0.939×(S ˜jgC-μ^jg)). ΔCt denotes the difference between the normal DNA sample versus SK-BR-3. The Ct is the cycle number at which the reporter fluorescence passes a fixed threshold above baseline. Positive ΔCt suggests amplification, while negative ΔCt suggests deletion.
Figure 3
Figure 3
(see facing page). Chromosome 8 (panel a) and chromosome 9 (panel b) analysis. The graphs on the left-hand side of panels (a) and (b) represent copy number estimation and genotype information. The x-axis is the chromosomal position (National Center for Biotechnology Information (NCBI) Build 33). For each sample, the genotype information is presented on top of each panel. The downward red line indicates a homozygous genotype, while the upward green line indicates a heterozygous genotype. Each panel shows the copy number estimation on the y-axis. The vertical green and red lines are individual single nucleotide polymorphism copy number estimates. The upward green lines represent an estimate that is larger than the baseline value of 2, while the downward red lines represent an estimate that is lower than 2. The black dotted lines indicate the relative location of the c-MYC and p-16 genes on chromosomes 8 and 9, respectively. The panels on the right-hand side represent the significance results. The x-axis is the chromosomal position (NCBI Build 33) and the black vertical lines represent the location of the c-MYC (panel a) and p-16 (panel b) genes. The y-axis is the log 10 transformed p-value of each given SNP. To distinguish deletions from amplifications, the log10 ( p-value) (upward green lines) is used when the target value is higher than the reference mean (amplifications) and the log10 (p-value) (downward red lines) is used when the target value is lower than the reference mean (deletions).
Figure 4
Figure 4
Receiver operating characteristic (ROC) curves for contiguous point analysis and single point analysis. In each panel, the false-positive rate is estimated by the average of leave-one-out cross-validation on 62 normal females (2X). The true-positive rate is estimated using 1X, 3X, 4X and 5X samples. With a range of p-value thresholds, a series of false-positive rates and true-positive rates can be calculated which form the basis of the ROC curves. Panels (c) and (d) are enlargements of (a) and (b), respectively, with the false-positive rate extending only to 1 per cent rather than 100 per cent.
Figure 5
Figure 5
Loss of heterozygosity (LOH) analysis on mixed samples. The x-axis is the percentage of mixing of the normal DNA sample. The y-axis is the proportion of LOH signal remaining using three measurements: LOH single nucleotide polymorphisms (red dots and line), total length of LOH (blue dots and line) and total number of LOH regions (green dots and line). The definition of LOH regions and length is described in detail in the methods section.

Similar articles

Cited by

References

    1. Albertson DG, Collins C, McCormick F. et al.'Chromosome aberrations in solid tumors'. Nat Genet. 2003;34:369–376. doi: 10.1038/ng1215. - DOI - PubMed
    1. Lengauer C, Kinzler KW, Vogelstein B. 'Genetic instabilities in human cancers'. Nature. 1998;396:643–649. doi: 10.1038/25292. - DOI - PubMed
    1. Cavenee WK, Dryja TP, Phillips RA. et al.'Expression of recessive alleles by chromosomal mechanisms in retinoblastoma'. Nature. 1983;305:779–784. doi: 10.1038/305779a0. - DOI - PubMed
    1. Kallioniemi A, Kallioniemi OP, Sudar D. et al.'Comparative genomic hybridization for molecular cytogenetic analysis of solid tumors'. Science. 1992;258:818–821. doi: 10.1126/science.1359641. - DOI - PubMed
    1. Schrock E, du Manoir S, Veldman T. et al.'Multicolor spectral karyotyping of human chromosomes'. Science. 1996;273:494–497. doi: 10.1126/science.273.5274.494. - DOI - PubMed

LinkOut - more resources