

Generalization as a behavioral window to the neural mechanisms of learning internal models
- PMID: 15589621
- PMCID: PMC2722915
- DOI: 10.1016/j.humov.2004.04.003
Generalization as a behavioral window to the neural mechanisms of learning internal models
Abstract
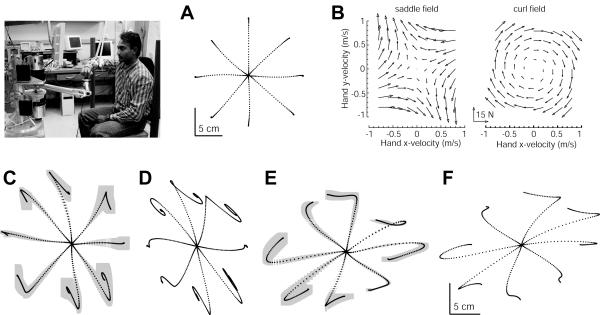
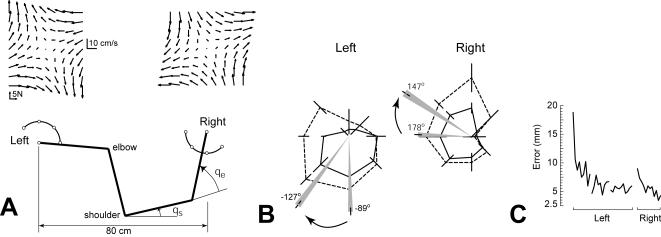
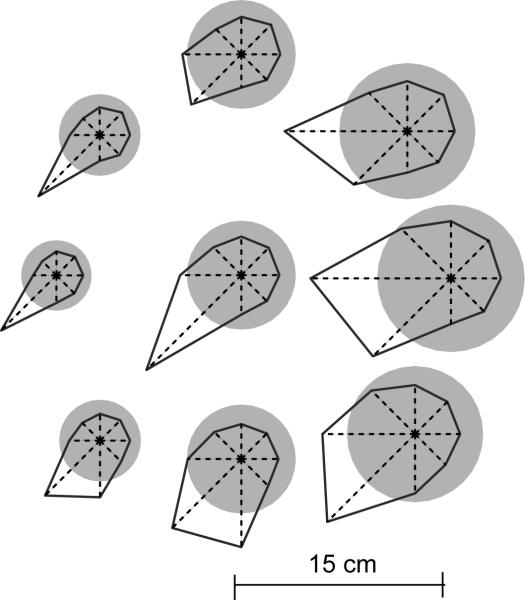
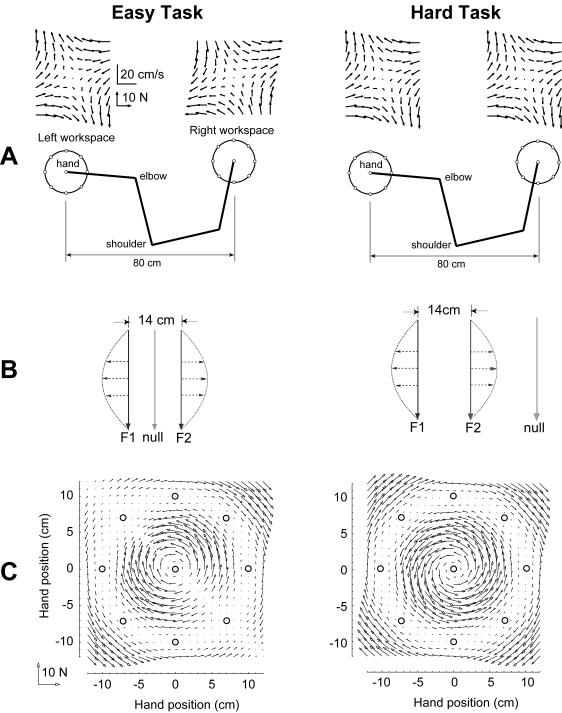
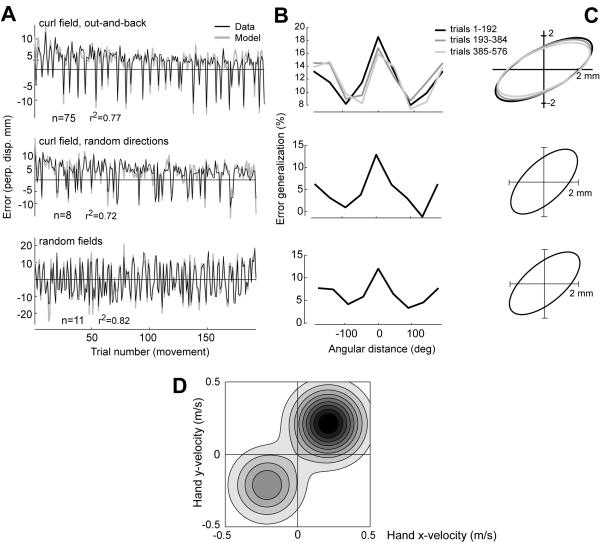
In generating motor commands, the brain seems to rely on internal models that predict physical dynamics of the limb and the external world. How does the brain compute an internal model? Which neural structures are involved? We consider a task where a force field is applied to the hand, altering the physical dynamics of reaching. Behavioral measures suggest that as the brain adapts to the field, it maps desired sensory states of the arm into estimates of force. If this neural computation is performed via a population code, i.e., via a set of bases, then activity fields of the bases dictate a generalization function that uses errors experienced in a given state to influence performance in any other state. The patterns of generalization suggest that the bases have activity fields that are directionally tuned, but directional tuning may be bimodal. Limb positions as well as contextual cues multiplicatively modulate the gain of tuning. These properties are consistent with the activity fields of cells in the motor cortex and the cerebellum. We suggest that activity fields of cells in these motor regions dictate the way we represent internal models of limb dynamics.
Figures
Similar articles
-
Estimating the sources of motor errors for adaptation and generalization.Nat Neurosci. 2008 Dec;11(12):1454-61. doi: 10.1038/nn.2229. Epub 2008 Nov 16. Nat Neurosci. 2008. PMID: 19011624 Free PMC article.
-
A gain-field encoding of limb position and velocity in the internal model of arm dynamics.PLoS Biol. 2003 Nov;1(2):E25. doi: 10.1371/journal.pbio.0000025. Epub 2003 Nov 17. PLoS Biol. 2003. PMID: 14624237 Free PMC article.
-
Internal models and contextual cues: encoding serial order and direction of movement.J Neurophysiol. 2005 Feb;93(2):786-800. doi: 10.1152/jn.00240.2004. Epub 2004 Sep 22. J Neurophysiol. 2005. PMID: 15385598
-
Internal models of limb dynamics and the encoding of limb state.J Neural Eng. 2005 Sep;2(3):S266-78. doi: 10.1088/1741-2560/2/3/S09. Epub 2005 Aug 31. J Neural Eng. 2005. PMID: 16135889 Free PMC article. Review.
-
Tool use and the distalization of the end-effector.Psychol Res. 2009 Jul;73(4):441-62. doi: 10.1007/s00426-009-0242-2. Epub 2009 Apr 4. Psychol Res. 2009. PMID: 19347356 Free PMC article. Review.
Cited by
-
Eye tracking a self-moved target with complex hand-target dynamics.J Neurophysiol. 2016 Oct 1;116(4):1859-1870. doi: 10.1152/jn.00007.2016. Epub 2016 Jul 27. J Neurophysiol. 2016. PMID: 27466129 Free PMC article.
-
Interlimb Generalization of Learned Bayesian Visuomotor Prior Occurs in Extrinsic Coordinates.eNeuro. 2018 Aug 8;5(4):ENEURO.0183-18.2018. doi: 10.1523/ENEURO.0183-18.2018. eCollection 2018 Jul-Aug. eNeuro. 2018. PMID: 30131969 Free PMC article.
-
Generalizing movement patterns following shoulder fixation.J Neurophysiol. 2020 Mar 1;123(3):1193-1205. doi: 10.1152/jn.00696.2019. Epub 2020 Feb 26. J Neurophysiol. 2020. PMID: 32101490 Free PMC article.
-
Principles of operation of a cerebellar learning circuit.Elife. 2020 Apr 30;9:e55217. doi: 10.7554/eLife.55217. Elife. 2020. PMID: 32352914 Free PMC article.
-
Altered connectivity and action model formation in autism is autism.Neuroscientist. 2011 Aug;17(4):437-48. doi: 10.1177/1073858410392381. Epub 2011 Apr 5. Neuroscientist. 2011. PMID: 21467306 Free PMC article. Review.
References
-
- Ajemian R, Bullock D, Grossberg S. A model of movement coordinates in the motor cortex: posture-dependent changes in the gain and direction of single cell tuning curves. Cerebral Cortex. 2001;11:1124–1135. - PubMed
-
- Amirikian B, Georgopoulos AP. Directional tuning profiles of motor cortical cells. Neuroscience Research. 2000;36:73–79. - PubMed
-
- Andersen RA, Essick GK, Siegel RM. Encoding of spatial location by posterior parietal neurons. Science. 1985;230:456–458. - PubMed
-
- Bosco G, Rankin A, Poppele RE. Representation of passive hindlimb postures in cat spinocerebellar activity. Journal of Neurophysiology. 1996;76:715–726. - PubMed
-
- Brashers-Krug T, Shadmehr R, Bizzi E. Consolidation in human motor memory. Nature. 1996;382:252–255. - PubMed
Publication types
MeSH terms
Grants and funding
LinkOut - more resources
Full Text Sources
