DNA footprinting and biophysical characterization of the controller protein C.AhdI suggests the basis of a genetic switch
- PMID: 15590905
- PMCID: PMC535683
- DOI: 10.1093/nar/gkh975
DNA footprinting and biophysical characterization of the controller protein C.AhdI suggests the basis of a genetic switch
Abstract
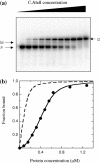
We have cloned and expressed the ahdIC gene of the AhdI restriction-modification system and have purified the resulting controller (C) protein to homogeneity. The protein sequence shows a HTH motif typical of that found in many transcriptional regulators. C.AhdI is found to form a homodimer of 16.7 kDa; sedimentation equilibrium experiments show that the dimer dissociates into monomers at low concentration, with a dissociation constant of 2.5 microM. DNase I and Exo III footprinting were used to determine the C.AhdI DNA-binding site, which is found approximately 30 bp upstream of the ahdIC operon. The intact homodimer binds cooperatively to a 35 bp fragment of DNA containing the C-protein binding site with a dissociation constant of 5-6 nM, as judged both by gel retardation analysis and by surface plasmon resonance, although in practice the affinity for DNA is dominated by protein dimerization as DNA binding by the monomer is negligible. The location of the C-operator upstream of both ahdIC and ahdIR suggests that C.AhdI may act as a positive regulator of the expression of both genes, and could act as a molecular switch that is critically dependent on the K(d) for the monomer-dimer equilibrium. Moreover, the structure and location of the C.AhdI binding site with respect to the putative -35 box preceding the C-gene suggests a possible mechanism for autoregulation of C.AhdI expression.
Figures


Similar articles
-
DNA structural deformations in the interaction of the controller protein C.AhdI with its operator sequence.Nucleic Acids Res. 2007;35(8):2643-50. doi: 10.1093/nar/gkm129. Epub 2007 Apr 10. Nucleic Acids Res. 2007. PMID: 17426137 Free PMC article.
-
Cooperative binding of the C.AhdI controller protein to the C/R promoter and its role in endonuclease gene expression.J Mol Biol. 2006 Apr 28;358(2):523-31. doi: 10.1016/j.jmb.2006.02.003. Epub 2006 Feb 20. J Mol Biol. 2006. PMID: 16516922
-
Purification and characterisation of a novel DNA methyltransferase, M.AhdI.Nucleic Acids Res. 2003 Jun 1;31(11):2803-10. doi: 10.1093/nar/gkg399. Nucleic Acids Res. 2003. PMID: 12771207 Free PMC article.
-
High-resolution crystal structure of the restriction-modification controller protein C.AhdI from Aeromonas hydrophila.J Mol Biol. 2005 Feb 25;346(3):689-701. doi: 10.1016/j.jmb.2004.12.025. Epub 2005 Jan 12. J Mol Biol. 2005. PMID: 15713456
-
Purification and in vitro activities of the Bacillus subtilis TnrA transcription factor.J Mol Biol. 2000 Jun 30;300(1):29-40. doi: 10.1006/jmbi.2000.3846. J Mol Biol. 2000. PMID: 10864496
Cited by
-
Binding site of restriction-modification system controller protein in Mollicutes.BMC Microbiol. 2017 Jan 31;17(1):26. doi: 10.1186/s12866-017-0935-4. BMC Microbiol. 2017. PMID: 28143392 Free PMC article.
-
DNA structural deformations in the interaction of the controller protein C.AhdI with its operator sequence.Nucleic Acids Res. 2007;35(8):2643-50. doi: 10.1093/nar/gkm129. Epub 2007 Apr 10. Nucleic Acids Res. 2007. PMID: 17426137 Free PMC article.
-
Controller protein of restriction-modification system Kpn2I affects transcription of its gene by acting as a transcription elongation roadblock.Nucleic Acids Res. 2018 Nov 16;46(20):10810-10826. doi: 10.1093/nar/gky880. Nucleic Acids Res. 2018. PMID: 30295835 Free PMC article.
-
Understanding key features of bacterial restriction-modification systems through quantitative modeling.BMC Syst Biol. 2017 Feb 24;11(Suppl 1):377. doi: 10.1186/s12918-016-0377-x. BMC Syst Biol. 2017. PMID: 28466789 Free PMC article.
-
RepD-mediated recruitment of PcrA helicase at the Staphylococcus aureus pC221 plasmid replication origin, oriD.Nucleic Acids Res. 2010 Apr;38(6):1874-88. doi: 10.1093/nar/gkp1153. Epub 2009 Dec 30. Nucleic Acids Res. 2010. PMID: 20044350 Free PMC article.
References
-
- Rimseliene R., Vaisvila,R. and Janulaitis,A. (1995) The eco72IC gene specifies a trans-acting factor which influences expression of both DNA methyltransferase and endonuclease from the Eco72I restriction-modification system. Gene, 157, 217–219. - PubMed
Publication types
MeSH terms
Substances
Grants and funding
LinkOut - more resources
Full Text Sources
Other Literature Sources
Molecular Biology Databases

