. 2004 Dec 8;24(49):11057-69.
doi: 10.1523/JNEUROSCI.2829-04.2004.

Sodium influx pathways during and after anoxia in rat hippocampal neurons

Affiliations

Sodium influx pathways during and after anoxia in rat hippocampal neurons

Claire Sheldon et al. J Neurosci. .

Abstract

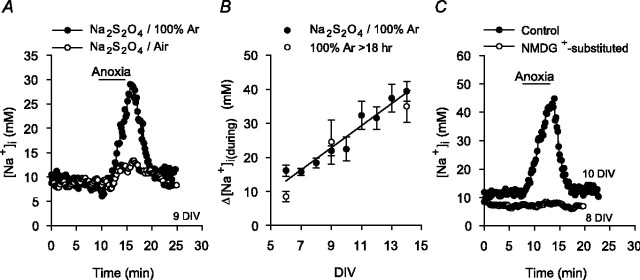
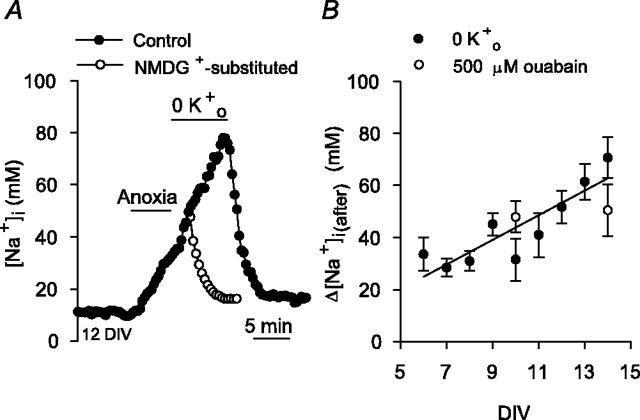
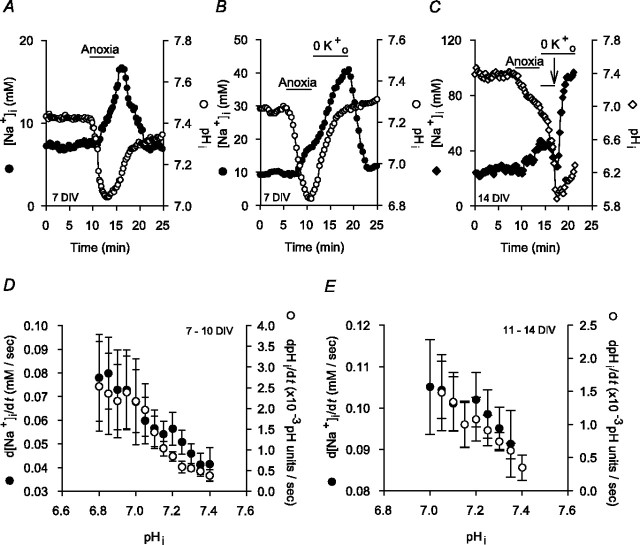
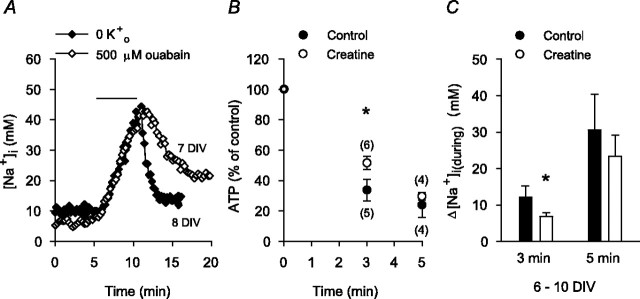
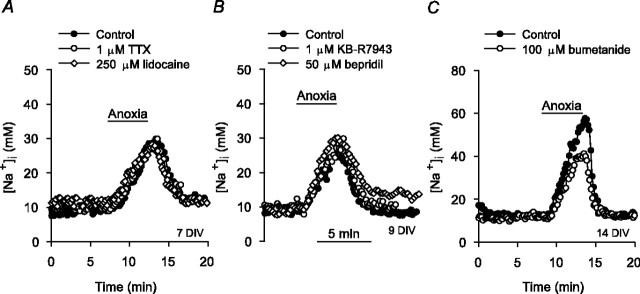
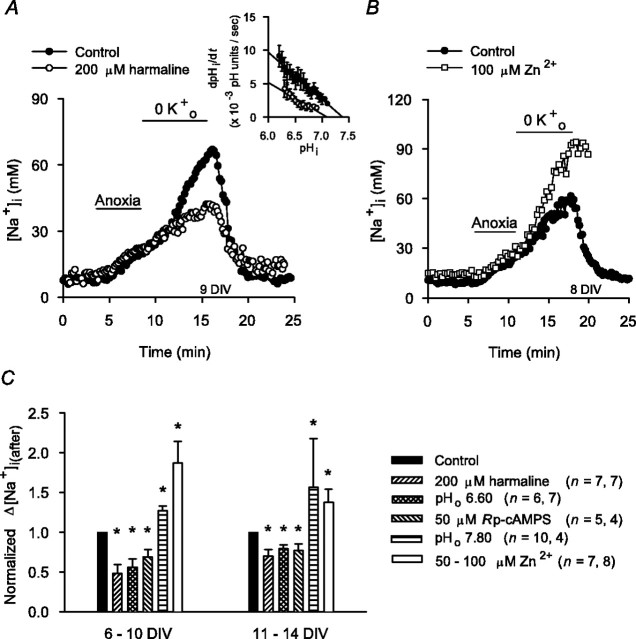
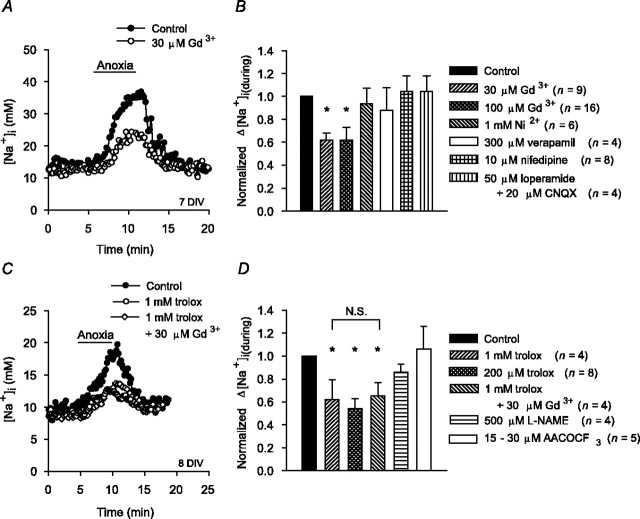
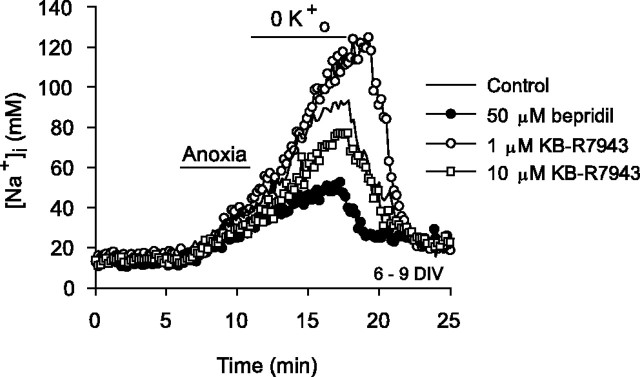
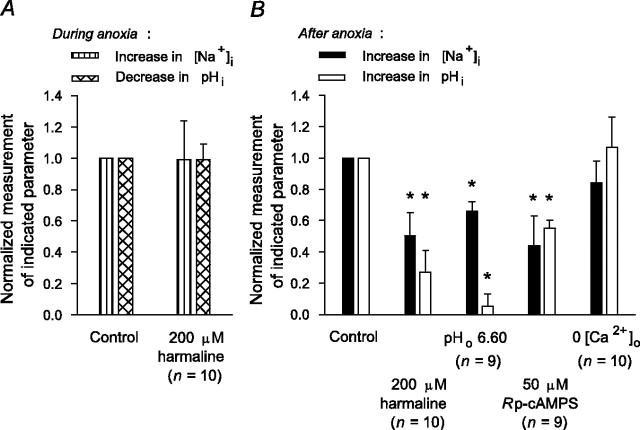
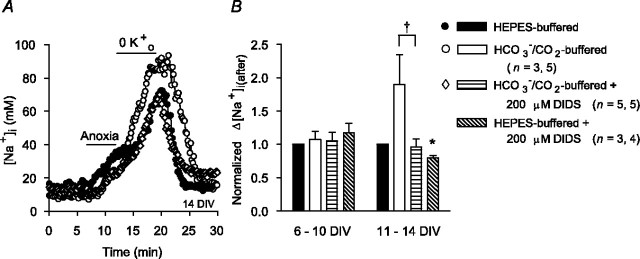
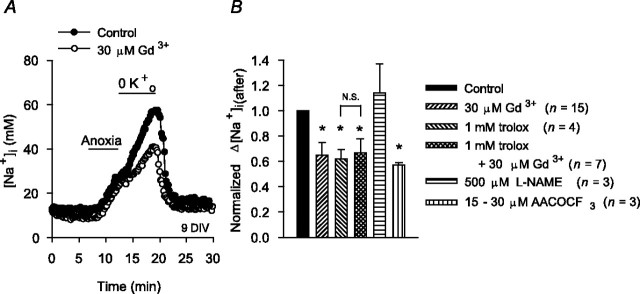
Mechanisms that contribute to Na+ influx during and immediately after 5 min anoxia were investigated in cultured rat hippocampal neurons loaded with the Na+-sensitive fluorophore sodium-binding benzofuran isophthalate. During anoxia, an influx of Na+ in the face of reduced Na+,K+-ATPase activity caused a rise in [Na+]i. After the return to normoxia, Na+,K+-ATPase activity mediated the recovery of [Na+]i despite continued Na+ entry. Sodium influx during and after anoxia occurred through multiple pathways and increased the longer neurons were maintained in culture. Under the experimental conditions used, Na+ entry during anoxia did not reflect the activation of ionotropic glutamate receptors, TTX- or lidocaine-sensitive Na+ channels, plasmalemmal Na+/Ca2+ exchange, Na+/H+ exchange, or HCO3--dependent mechanisms; rather, contributions were received from a Gd3+-sensitive pathway activated by reactive oxygen species and Na+/K+/2Cl- cotransport in neurons maintained for 6-10 and 11-14 d in vitro (DIV), respectively. Sodium entry immediately after anoxia was not attributable to the activation of ionotropic glutamate receptors, voltage-activated Na+ channels, or Na+/K+/2Cl- cotransport; rather, it occurred via Na+/Ca2+ exchange, Na+/H+ exchange, and a Gd3+-sensitive pathway similar to that observed during anoxia; 11-14 DIV neurons received an additional contribution from an -dependent mechanism(s). The results provide insight into the intrinsic mechanisms that contribute to disturbed internal Na+ homeostasis during and immediately after anoxia in rat hippocampal neurons and, in this way, may play a role in the pathogenesis of anoxic or ischemic cell injury.


Figures

Figure 1.
Figure 1.
Changes in [Na+]i evoked by 5 min anoxia in cultured postnatal rat hippocampal neurons. A, Anoxia was imposed under nominally formula image-free, HEPES-buffered conditions by exposure to medium containing 1-2 mm sodium dithionite and bubbled vigorously with 100% Ar (•). Also shown are the changes in neuronal [Na+]i evoked by anoxia in an age-matched sister culture exposed to medium containing 1-2 mm sodium dithionite and bubbled vigorously with air (○). B, Relationship between the magnitude of the increase in [Na+]i during anoxia (Δ[Na+]i(during)) and the number of days that neurons had been maintained in culture (DIV). Anoxia was imposed under HEPES-buffered conditions either by the addition of sodium dithionite to medium bubbled with 100% Ar (•; n = 21-54 for each datum point) or by the exposure to medium that had been bubbled vigorously with 100% Ar for >18 hr (○; n ≥3 for each datum point). The solid line represents a linear regression fit to the data points obtained when anoxia was imposed by the addition of sodium dithionite (correlation coefficient, 0.95; p < 0.0001). C, Under normal Na+o-containing conditions, anoxia induced an increase in [Na+]i that recovered after the return to normoxia (•). When anoxia was imposed under reduced Na+o, NMDG+-substituted conditions, the increase in [Na+]i was inhibited (○).
Figure 5.
Figure 5.
Changes in [Na+]i after anoxia. A, Na+,K+-ATPase activity was inhibited by perfusion with K+-free medium at the end of 5 min anoxia, revealing a secondary rise in [Na+]i in the immediate postanoxic period (•). Age-matched sister neurons on a different coverslip were exposed to K+- and Na+-free medium after 5 min anoxia imposed under control conditions (○); in the absence of external Na+ (NMDG+-substituted), the increase in [Na+]i after anoxia was abolished. B, Relationship between the magnitude of the increase in [Na+]i after anoxia (Δ[Na+]i(after)) and the number of days neurons had been maintained in culture (DIV). Δ[Na+]i(after) was determined as the difference between the [Na+]i value observed at the end of 5 min anoxia and the [Na+]i value observed at the end of 7 min superfusion with K+-free medium (•; n = 7-31 for each datum point). The solid line represents the linear regression fit to the data points indicated (correlation coefficient, 0.88; p < 0.0001). Also shown are Δ[Na+]i(after) values obtained when Na+, K+-ATPase activity was inhibited for 7 min with 500 μm ouabain (○; n = 3 for each datum point).
Figure 8.
Figure 8.
Anoxia-evoked changes in pHi and [Na+]i in rat hippocampal neurons coloaded with SBFI and SNARF-5F. A, Anoxia induced an increase in [Na+]i (•) and a fall in pHi (○), both of which recovered toward resting values after the return to normoxia. B, Inhibition of Na+,K+-ATPase activity (perfusion with K+-free medium) for 7 min after anoxia failed to influence the postanoxic rise in pHi (•) but revealed an additional increase in [Na+]i (•). C, During 5 min anoxia imposed in the presence of external Na+, [Na+]i (♦) increased and pHi (⋄) fell. Immediately after anoxia, neurons were superfused with K+- and Na+-free medium (pHo constant at 7.35). Reducing Na+o (NMDG+ substitution) for the period indicated by the short bar above the records prevented the increases in pHi and [Na+]i seen after anoxia in the presence of normal Na+o (compare with B). After the return to normal Na+o (in the continued absence of external K+; arrow), both pHi and [Na+]i increased. D, Measured in 20 neurons maintained for 7-10 DIV and coloaded with SBFI and SNARF-5F, rates at which [Na+]i (•) and pHi (○) increased immediately after anoxia (Na+,K+-ATPase inhibited) exhibited an inverse dependence on absolute pHi values. Similar results were observed in 11-14 DIV neuronal cultures (E; n = 10). In D and E, rates at which pHi and [Na+]i increased after anoxia under K+o-free conditions were determined by fitting the pHi and [Na+]i records to single exponential functions; the first derivatives of these functions were used to determine rates of pHi and [Na+]i increase at 0.05 pH unit and 5 mm intervals, respectively. The pHi values at which rates of [Na+]i increase were measured were determined from obtained curve-fitted parameters.
Figure 2.
Figure 2.
Contribution of reduced Na+,K+-ATPase activity to the increase in [Na+]i during anoxia. A, Superimposed records of the changes in [Na+]i observed under normoxic conditions in response to 5 min exposures to either K+-free medium (♦) or normal medium (3 mm K+) containing 500 μm ouabain (⋄), as indicated by the bar above the traces. B, Internal ATP levels were determined after 3 and 5 min anoxia induced by exposure to sodium dithionite-containing medium in 6-10 DIV neurons under control conditions (•) or after pretreatment with 10 mm creatine for 2 hr (○). In each experimental group, ATP levels were normalized to preanoxic measurements made in age-matched sister neuronal cultures. The fall in internal ATP levels evoked by 3 min, but not 5 min, anoxia under control conditions was significantly attenuated by creatine pretreatment (*p < 0.05). The numbers in parentheses indicate the number of neuronal populations examined under each experimental condition. C, In neurons pretreated with 10 mm creatine for 2 hr (□), the increase in [Na+]i measured 3 min after the start of anoxia was significantly less than that observed under control conditions (▪; *p < 0.05; n = 6 neuronal cultures at 6-10 DIV in each case). The increases in [Na+]i measured after 5 min anoxia under control conditions and in creatine-treated, age-matched sister neurons were not significantly different (p = 0.57).
Figure 3.
Figure 3.
Contribution of voltage-activated Na+ channels, Na+/Ca2+ exchange, and Na+/K+/2Cl- cotransport to the increase in [Na+]i during anoxia. Shown are superimposed records of the changes in [Na+]i observed in response to 5 min anoxia imposed in age-matched sister neurons under control conditions (•) and in the presence of an experimental treatment (open symbols); pharmacological inhibitors were present throughout the duration of the traces shown. A, Neither 1 μm TTX nor 250 μm lidocaine affected the increase in [Na+]i during anoxia. B, Neither 1 μm KB-R7943 nor 50 μm bepridil exerted a significant effect on the increase in [Na+]i during anoxia. C, A concentration of 100 μm bumetanide significantly reduced the rise in [Na+]i during anoxia in 14 DIV neurons. See also Table 1.
Figure 7.
Figure 7.
Effects of maneuvers that modulate Na+/H+ exchange activity on increases in [Na+]i after anoxia (Na+,K+-ATPase inhibited). A, At the end of 5 min anoxia, neurons were exposed to K+-free medium for 7 min. Compared with the increase in [Na+]i seen under control conditions (•), the increase in [Na+]i after anoxia was reduced by 60 min pretreatment with 200 μm harmaline (○). Inset, Rates of pHi recovery from internal acid loads imposed under nominally formula image-free, HEPES-buffered normoxic control conditions (•; n = 10) or after 60 min pretreatment with 200 μm harmaline (○; n = 6). Harmaline pretreatment reduced rates of pHi recovery, consistent with inhibition of Na+/H+ exchange activity. B, Compared with the [Na+]i changes evoked by 5 min anoxia under control conditions (•), the increase in [Na+]i after anoxia in age-matched sister neurons was augmented by exposure to 100 μm Zn2+ (□). Exposure to Zn2+ began immediately after the end of 5 min anoxia and continued for the duration of the record shown. C, Summary of the effects of maneuvers that modulate Na+/H+ exchange activity on the increase in [Na+]i after anoxia in 6-10 and 11-14 DIV neurons. The asterisk indicates statistical significance (p < 0.05) compared with measurements made in age-matched sister neurons under control conditions.
Figure 4.
Figure 4.
Effect of Gd3+ on the increase in [Na+]i during anoxia. A, Compared with the increase observed in age-matched sister neurons under control conditions (•), the increase in [Na+]i during anoxia was reduced in the presence of 30 μm Gd3+ (○). B, Summary of the effects of Gd3+ and the other treatments indicated on the figure on the increase in [Na+]i during anoxia in 6-10 DIV neuronal cultures. C, After 2 hr pretreatment with 1 mm trolox, the increase in [Na+]i during anoxia was reduced (○) compared with that observed in age-matched sister neurons not pretreated with the antioxidant (•). In sister neurons pretreated with 1 mm trolox, 30 μm Gd3+ failed to attenuate the residual increase in [Na+]i during anoxia (⋄). D, Summary of the effects of the test treatments indicated on the figure on the increases in [Na+]i during anoxia in 6-10 DIV neurons. Neurons were exposed to l-NAME or AACOCF3 for 20 min before the start of anoxia. In B and D, the asterisk indicates statistical significance (p < 0.05) compared with measurements made in age-matched sister neurons under control conditions. In neurons pretreated with trolox, there was no statistically significant difference (N.S.; p = 0.54) between the increases in [Na+]i observed during anoxia in the presence and absence of Gd3+.
Figure 6.
Figure 6.
Effects of pharmacological modulators of Na+/Ca2+ exchange activity on increases in [Na+]i after anoxia (Na+,K+-ATPase inhibited). Neurons were exposed to K+-free medium for 7 min at the end of 5 min anoxia. Compared with the increase in [Na+]i observed under control conditions (-), the increase in [Na+]i after anoxia was reduced in the presence of 50 μm bepridil (•) or 10 μm KB-R7943 (□) and was enhanced in the presence of 1 μm KB-R7943 (○). Pharmacological treatments began at the end of 5 min anoxia and were continued for the duration of the records shown. See also Table 2.
Figure 9.
Figure 9.
The influence of maneuvers that inhibit Na+/H+ exchange activity on anoxia-evoked changes in [Na+]i and pHi measured concurrently in neurons coloaded with SBFI and either carboxy SNARF-1 or SNARF-5F. Measurements of the changes in [Na+]i and pHi observed during (A) and after (B) anoxia under the test conditions indicated on the figure were normalized to corresponding measurements made in experiments performed on age-matched sister neurons (7-10 DIV) under control conditions. Statistical comparisons were performed by comparing absolute measurements of anoxia-evoked changes in [Na+]i and pHi made under a given test condition with corresponding measurements made in age-matched sister neurons under control conditions. The asterisk indicates statistical significance (p < 0.05) compared with measurements made in age-matched sister neurons under control conditions. The numbers in parentheses indicate the number of neurons from which data were obtained under each test condition.
Figure 10.
Figure 10.
Contribution of formula image-dependent mechanisms to increases in [Na+]i after anoxia (Na+,K+-ATPase inhibited). A, Under HEPES-buffered (•) or formula image-buffered (○) conditions, neurons were exposed to 5 min anoxia, followed by 7 min perfusion with K+-free medium. The augmented increase in [Na+]i observed after anoxia in the presence of formula image was inhibited by 200 μm DIDS (⋄), which was added at the start of anoxia and remained present throughout the rest of the record shown. B, Summary of the effects of external buffering conditions and DIDS on the increase in [Na+]i after anoxia in 6-10 and 11-14 DIV neurons. In contrast to results obtained in 6-10 DIV neurons, the increase in [Na+]i after anoxia in 11-14 DIV neurons was enhanced in the presence of formula image and, under this condition, DIDS significantly reduced (p < 0.05) the magnitude of the rise in [Na+]i to a value not significantly different (p = 0.66) to that seen under formula image-free, HEPES-buffered conditions. In 11-14 DIV neurons, DIDS also significantly (*p < 0.05) reduced the increase in [Na+]i observed after anoxia under nominally formula image-free, HEPES-buffered conditions. There was no significant difference (p = 0.15) between the increases in [Na+]i after anoxia observed in the presence of DIDS under formula image-containing versus nominally formula image-free conditions.
Figure 11.
Figure 11.
Effects of Gd3+ on increases in [Na+]i after anoxia (Na+,K+-ATPase inhibited). A, Exposure to 30 μm Gd3+ immediately after anoxia under K+o-free conditions (○) reduced the increase in [Na+]i after anoxia compared with that observed in age-matched sister neurons under control conditions (•). B, Summary of the effects of the test treatments indicated on the figure on the increases in [Na+]i after anoxia in 6-10 DIV neuronal cultures. Neurons were pretreated with trolox for 2 hr before the start of anoxia and with l-NAME or AACOCF3 for 20 min before the start of anoxia. The asterisk indicates statistical significance (p < 0.05) compared with measurements made in age-matched sister neurons under control conditions. N.S., No statistically significant difference (p = 0.67) between the increase in [Na+]i observed after anoxia in the absence and presence of Gd3+ in neurons pretreated with trolox.

Similar articles

Cited by

References

    1. Aarts M, Iihara K, Wei W-L, Xiong K-G, Arundine M, Cerwinski W, MacDonald JF, Tymianski M (2003) A key role for TRPM7 channels in anoxic neuronal death. Cell 115: 863-877. - PubMed
    1. Anderson SE, Dickinson CZ, Liu H, Cala PM (1996) Effects of Na-K-2Cl cotransport inhibition on myocardial Na and Ca during ischemia and reperfusion. Am J Physiol 270: C608-C618. - PubMed
    1. Attaphitaya S, Park K, Melvin JE (1999) Molecular cloning and functional expression of a rat Na+/H+ exchanger (NHE5) highly expressed in brain. J Biol Chem 274: 4383-4388. - PubMed
    1. Avkiran M (2001) Protection of the ischemic myocardium by Na+/H+ exchange inhibitors: potential mechanisms of action. Basic Res Cardiol 96: 306-311. - PubMed
    1. Balestrino M, Lensman M, Parodi M, Perasso L, Rebaudo R, Melani R, Polenov S, Cupello A (2002) Role of creatine and phosphocreatine in neuronal protection from anoxic and ischemic damage. Amino Acids 23: 221-229. - PubMed

Publication types

MeSH terms

LinkOut - more resources