

Spontaneous opening of T-type Ca2+ channels contributes to the irregular firing of dopamine neurons in neonatal rats
- PMID: 15590924
- PMCID: PMC1454359
- DOI: 10.1523/JNEUROSCI.2713-04.2004
Spontaneous opening of T-type Ca2+ channels contributes to the irregular firing of dopamine neurons in neonatal rats
Erratum in
- J Neurosci. 2005 Jan 5;25(1):2 p following 198
Abstract
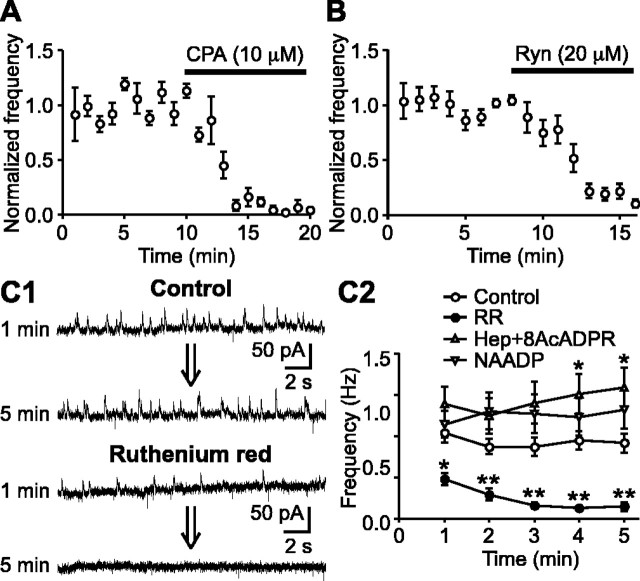
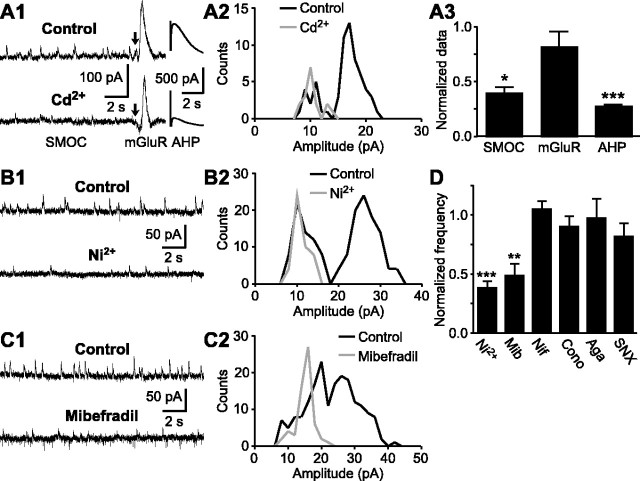
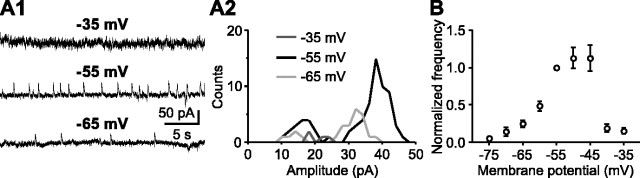
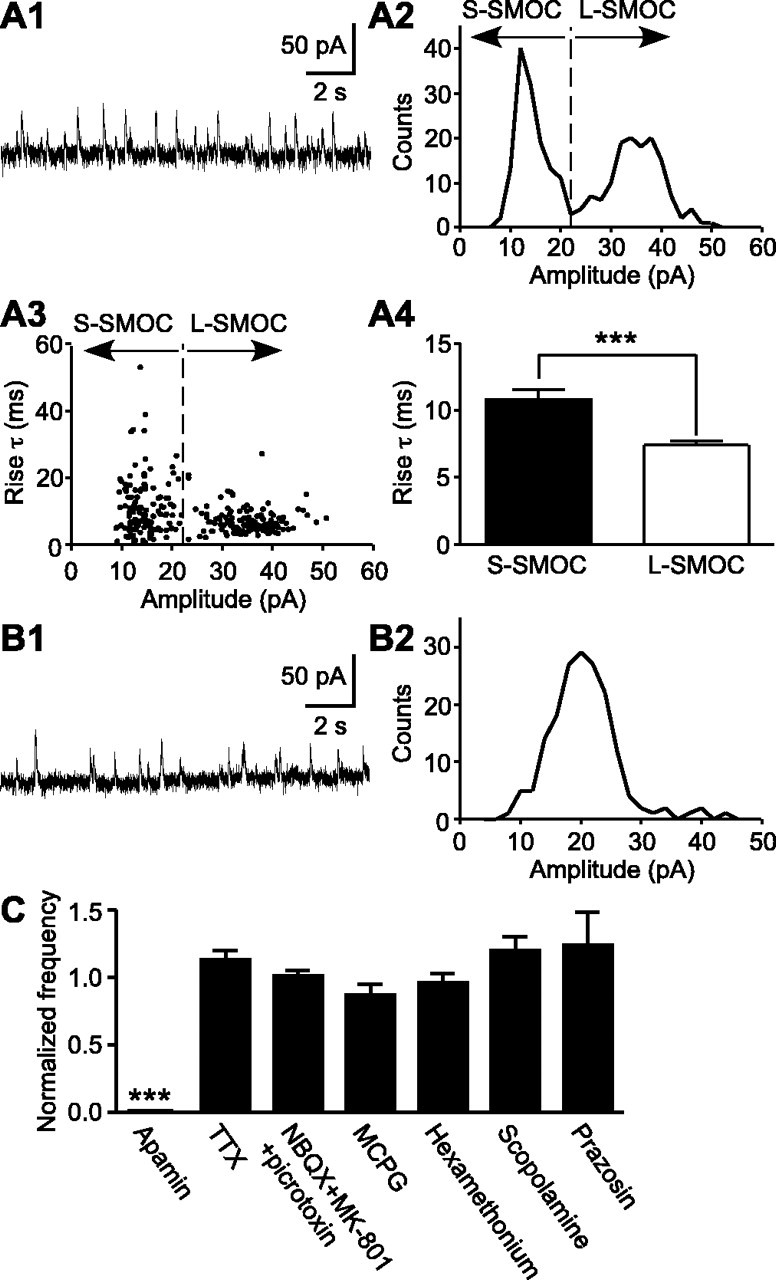
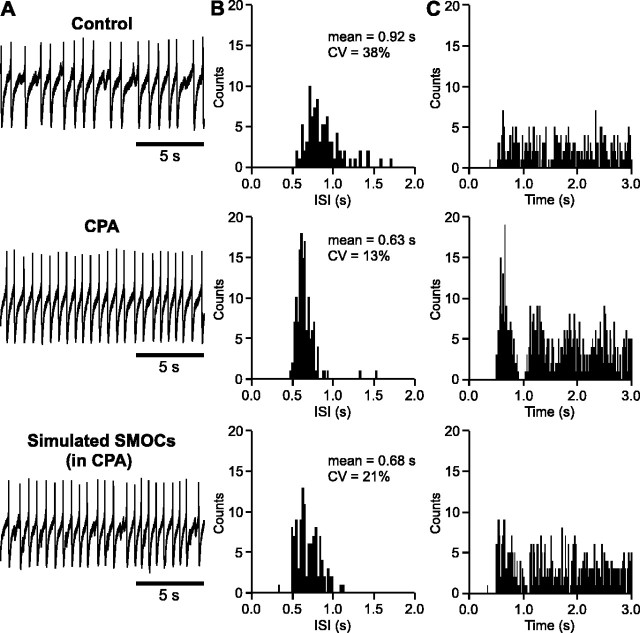
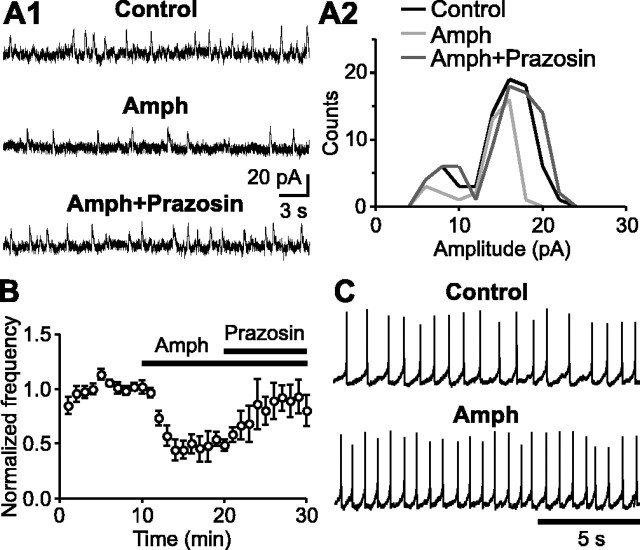
During early postnatal development, midbrain dopamine (DA) neurons display anomalous firing patterns and amphetamine response. Spontaneous miniature hyperpolarizations (SMHs) are observed in DA neurons during the same period but not in adults. These hyperpolarizations have been shown to be dependent on the release of Ca2+ from internal stores and the subsequent activation of Ca2+-sensitive K+ channels. However, the triggering mechanism and the functional significance of SMHs remain poorly understood. To address these issues, using brain slices, we recorded spontaneous miniature outward currents (SMOCs) in DA neurons of neonatal rats. Two types of SMOCs were identified based on the peak amplitude. Both types were suppressed by intracellular dialysis of ruthenium red, a ryanodine receptor (RyR) antagonist, yet none of the known Ca2+-releasing messengers were involved. T-type Ca2+ channel blockers (Ni2+ and mibefradil) inhibited large-amplitude SMOCs without affecting the small-amplitude ones. The voltage dependence of SMOCs displayed a peak of approximately -50 mV, consistent with the involvement of low-threshold T-type Ca2+ channels. Blockade of SMOCs with cyclopiazonic acid or ryanodine converted the irregular firing of DA neurons in neonatal rats into an adult-like pacemaker pattern. This effect was reversed by the injection of artificial currents mimicking SMOCs. Finally, amphetamine inhibited SMOCs and transformed the irregular firing pattern into a more regular one. These data demonstrate that Ca2+ influx through T-type Ca2+ channels, followed by Ca2+-induced Ca2+ release via RyRs, contributes to the generation of SMOCs. We propose that SMOCs-SMHs may underlie the anomalous firing and amphetamine response of DA neurons during the postnatal developmental period.
Figures

Similar articles
-
Ca(2+)-activated ion currents triggered by ryanodine receptor-mediated Ca(2+) release control firing of inhibitory neurons in the prepositus hypoglossi nucleus.J Neurophysiol. 2013 Jan;109(2):389-404. doi: 10.1152/jn.00617.2012. Epub 2012 Oct 24. J Neurophysiol. 2013. PMID: 23100137
-
Mechanism of generation of spontaneous miniature outward currents (SMOCs) in retinal amacrine cells.J Gen Physiol. 2002 Apr;119(4):355-72. doi: 10.1085/jgp.20028478. J Gen Physiol. 2002. PMID: 11929886 Free PMC article.
-
Spontaneous ryanodine-receptor-dependent Ca2+-activated K+ currents and hyperpolarizations in rat medial preoptic neurons.J Neurophysiol. 2010 May;103(5):2900-11. doi: 10.1152/jn.00566.2009. Epub 2010 Mar 24. J Neurophysiol. 2010. PMID: 20457857
-
SK channels and the varieties of slow after-hyperpolarizations in neurons.Eur J Neurosci. 2003 Dec;18(12):3155-66. doi: 10.1111/j.1460-9568.2003.03040.x. Eur J Neurosci. 2003. PMID: 14686890 Review.
-
Channels underlying neuronal calcium-activated potassium currents.Prog Neurobiol. 2002 Apr;66(5):345-53. doi: 10.1016/s0301-0082(02)00004-7. Prog Neurobiol. 2002. PMID: 12015199 Review.
Cited by
-
Nonselective cation channels are essential for maintaining intracellular Ca2+ levels and spontaneous firing activity in the midbrain dopamine neurons.Pflugers Arch. 2007 Nov;455(2):309-21. doi: 10.1007/s00424-007-0279-2. Epub 2007 May 10. Pflugers Arch. 2007. PMID: 17492308
-
Double-Nanodomain Coupling of Calcium Channels, Ryanodine Receptors, and BK Channels Controls the Generation of Burst Firing.Neuron. 2017 Nov 15;96(4):856-870.e4. doi: 10.1016/j.neuron.2017.10.014. Neuron. 2017. PMID: 29144974 Free PMC article.
-
Ca(2+) signaling by T-type Ca(2+) channels in neurons.Pflugers Arch. 2009 Mar;457(5):1161-72. doi: 10.1007/s00424-008-0582-6. Epub 2008 Sep 11. Pflugers Arch. 2009. PMID: 18784939 Review.
-
The role of calcium and mitochondrial oxidant stress in the loss of substantia nigra pars compacta dopaminergic neurons in Parkinson's disease.Neuroscience. 2011 Dec 15;198:221-31. doi: 10.1016/j.neuroscience.2011.08.045. Epub 2011 Aug 25. Neuroscience. 2011. PMID: 21884755 Free PMC article. Review.
-
Carbachol induces burst firing of dopamine cells in the ventral tegmental area by promoting calcium entry through L-type channels in the rat.J Physiol. 2005 Oct 15;568(Pt 2):469-81. doi: 10.1113/jphysiol.2005.094722. Epub 2005 Aug 4. J Physiol. 2005. PMID: 16081481 Free PMC article.
References
-
- Augustine GJ, Santamaria F, Tanaka K (2003) Local calcium signaling in neurons. Neuron 40: 331-346. - PubMed
-
- Bak J, White P, Timar G, Missiaen L, Genazzani AA, Galione A (1999) Nicotinic acid adenine dinucleotide phosphate triggers Ca2+ release from brain microsomes. Curr Biol 9: 751-754. - PubMed
-
- Bean BP (1989) Classes of calcium channels in vertebrate cells. Annu Rev Physiol 51: 367-384. - PubMed
Publication types
MeSH terms
Substances
Grants and funding
LinkOut - more resources
Full Text Sources
Miscellaneous