

Persistence of parahippocampal representation in the absence of stimulus input enhances long-term encoding: a functional magnetic resonance imaging study of subsequent memory after a delayed match-to-sample task
- PMID: 15590925
- PMCID: PMC6730271
- DOI: 10.1523/JNEUROSCI.3807-04.2004
Persistence of parahippocampal representation in the absence of stimulus input enhances long-term encoding: a functional magnetic resonance imaging study of subsequent memory after a delayed match-to-sample task
Abstract
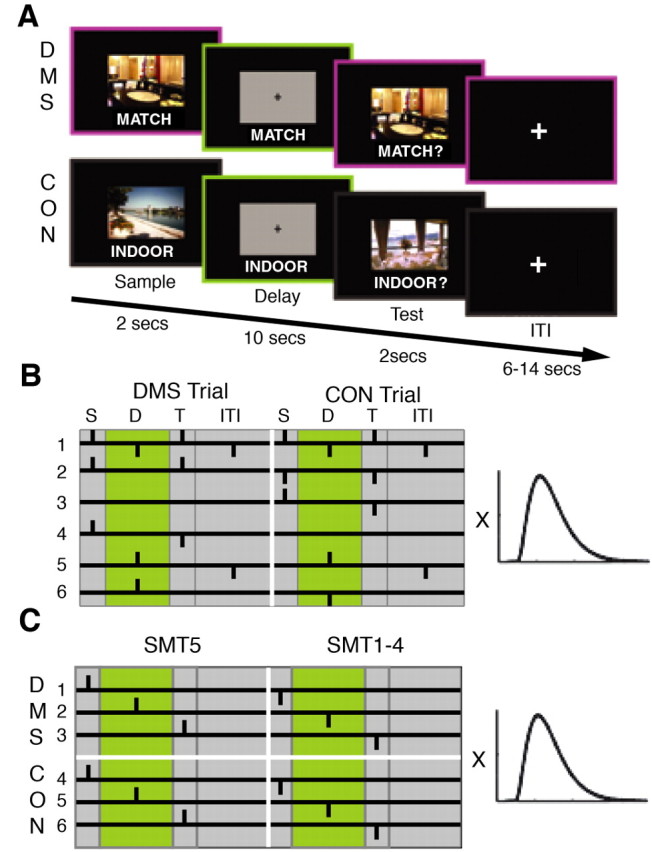
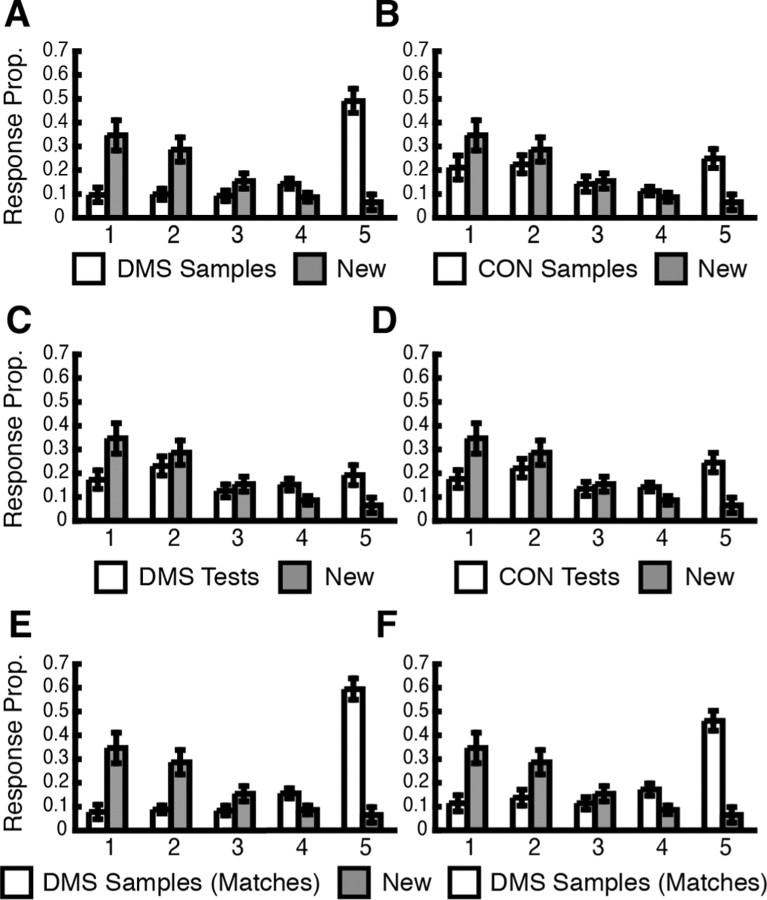
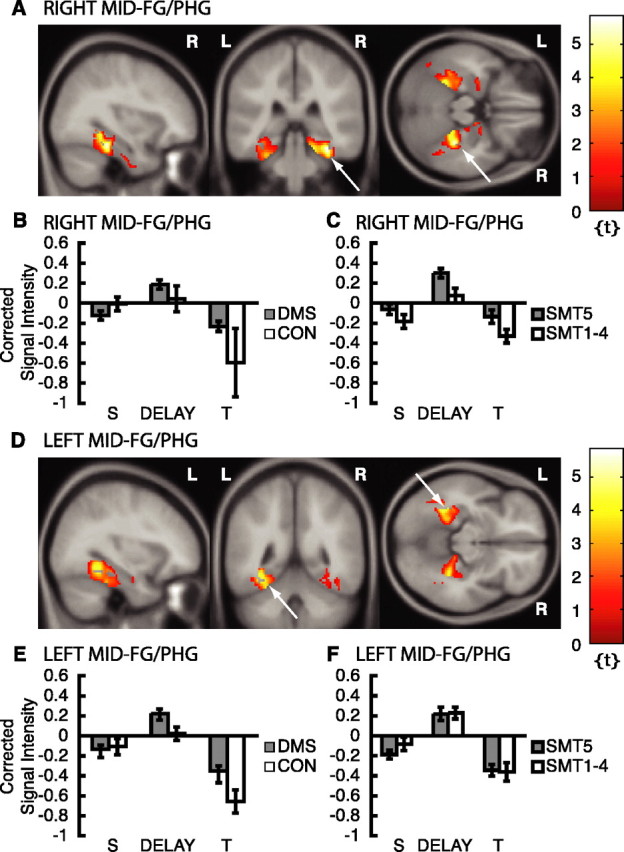
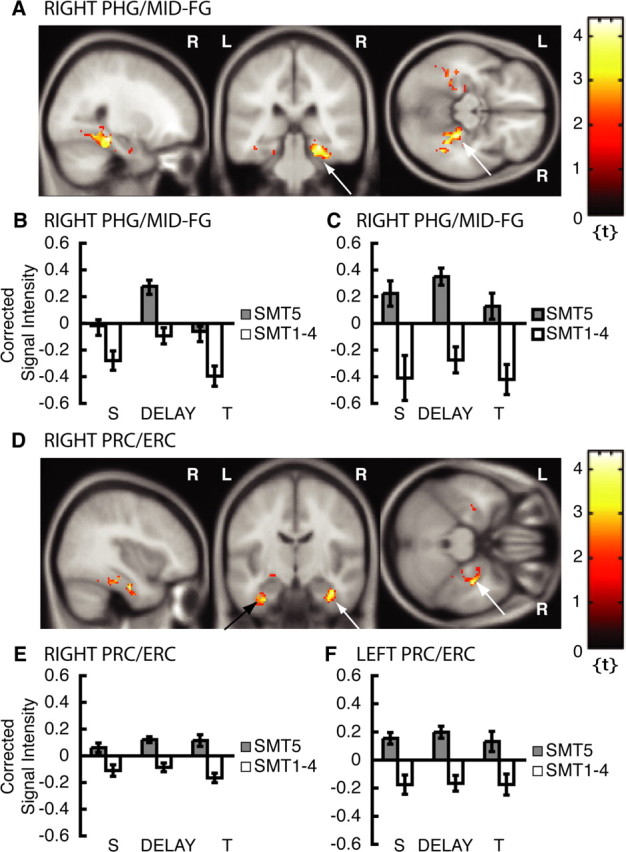
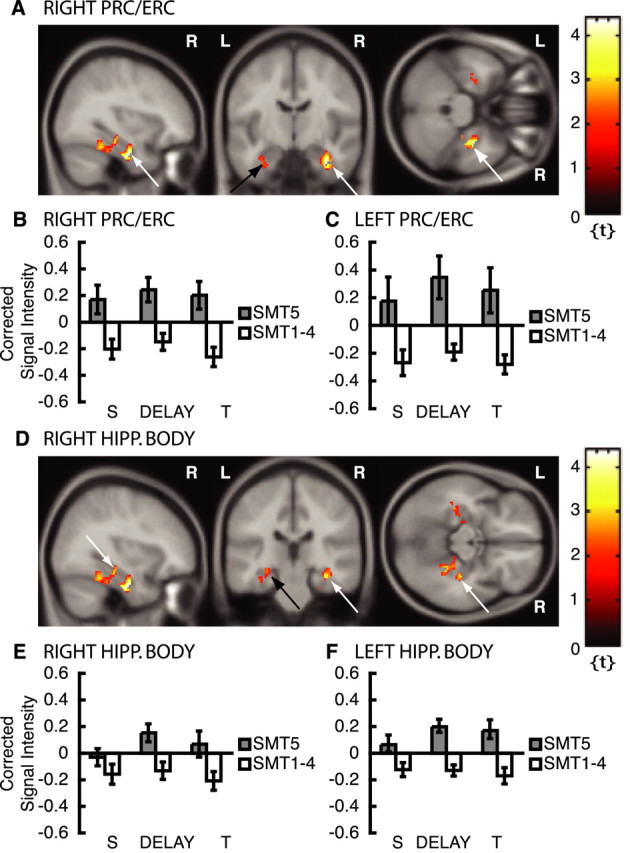
Recent theoretical models based on cellular processes in parahippocampal structures show that persistent neuronal spiking in the absence of stimulus input is important for encoding. The goal of this study was to examine in humans how sustained activity in the parahippocampal gyrus may underlie long-term encoding as well as active maintenance of novel information. The relationship between long-term encoding and active maintenance of novel information during brief memory delays was studied using functional magnetic resonance imaging (fMRI) in humans performing a delayed matching-to-sample (DMS) task and a post-scan subsequent recognition memory task of items encountered during DMS task performance. Multiple regression analyses revealed fMRI activity in parahippocampal structures associated with the active maintenance of trial-unique visual information during a brief memory delay. In addition to a role in active maintenance, we found that the subsequent memory for the sample stimuli as measured by the post-scan subsequent recognition memory task correlated with activity in the parahippocampal gyrus during the delay period. The results provide direct evidence that encoding mechanisms are engaged during brief memory delays when novel information is actively maintained. The relationship between active maintenance during the delay period and long-term subsequent memory is consistent with current theoretical models and experimental data that suggest that long-term encoding is enhanced by sustained parahippocampal activity.
Figures
Similar articles
-
High-resolution fMRI of content-sensitive subsequent memory responses in human medial temporal lobe.J Cogn Neurosci. 2010 Jan;22(1):156-73. doi: 10.1162/jocn.2009.21195. J Cogn Neurosci. 2010. PMID: 19199423 Free PMC article.
-
A Working Memory Buffer in Parahippocampal Regions: Evidence from a Load Effect during the Delay Period.Cereb Cortex. 2016 May;26(5):1965-74. doi: 10.1093/cercor/bhv013. Epub 2015 Feb 6. Cereb Cortex. 2016. PMID: 25662713 Free PMC article.
-
Human hippocampal and parahippocampal activity during visual associative recognition memory for spatial and nonspatial stimulus configurations.J Neurosci. 2003 Oct 15;23(28):9439-44. doi: 10.1523/JNEUROSCI.23-28-09439.2003. J Neurosci. 2003. PMID: 14561873 Free PMC article. Clinical Trial.
-
[Functional neuroimaging studies of episodic memory--functional dissociation in the medial temporal lobe structures].Brain Nerve. 2008 Jul;60(7):833-44. Brain Nerve. 2008. PMID: 18646623 Review. Japanese.
-
Imaging recollection and familiarity in the medial temporal lobe: a three-component model.Trends Cogn Sci. 2007 Sep;11(9):379-86. doi: 10.1016/j.tics.2007.08.001. Epub 2007 Aug 17. Trends Cogn Sci. 2007. PMID: 17707683 Review.
Cited by
-
Reduced spiking in entorhinal cortex during the delay period of a cued spatial response task.Learn Mem. 2012 May 15;19(6):219-30. doi: 10.1101/lm.025866.112. Learn Mem. 2012. PMID: 22589278 Free PMC article.
-
Post traumatic brain perfusion SPECT analysis using reconstructed ROI maps of radioactive microsphere derived cerebral blood flow and statistical parametric mapping.BMC Med Imaging. 2008 Feb 29;8:4. doi: 10.1186/1471-2342-8-4. BMC Med Imaging. 2008. PMID: 18312639 Free PMC article.
-
Multi-site exploration of sex differences in brain reactivity to smoking cues: Consensus across sites and methodologies.Drug Alcohol Depend. 2017 Sep 1;178:469-476. doi: 10.1016/j.drugalcdep.2017.05.044. Epub 2017 Jul 8. Drug Alcohol Depend. 2017. PMID: 28711813 Free PMC article.
-
Contributions of Hippocampal Volume to Cognition in Healthy Older Adults.Front Aging Neurosci. 2020 Nov 5;12:593833. doi: 10.3389/fnagi.2020.593833. eCollection 2020. Front Aging Neurosci. 2020. PMID: 33250765 Free PMC article.
-
Working memory for social cues recruits orbitofrontal cortex and amygdala: a functional magnetic resonance imaging study of delayed matching to sample for emotional expressions.J Neurosci. 2008 Apr 2;28(14):3718-28. doi: 10.1523/JNEUROSCI.0464-08.2008. J Neurosci. 2008. PMID: 18385330 Free PMC article.
References
-
- Atkinson RC, Shiffrin RM (1968) Human memory: a proposed system and its control processes. In: The psychology of learning and motivation (Spence KW, Spence JT, eds), pp 89-105. New York: Academic.
-
- Baddeley A (2000) The episodic buffer: a new component of working memory? Trends Cogn Sci 4: 417-423. - PubMed
-
- Baddeley A, Wilson BA (2002) Prose recall and amnesia: implications for the structure of working memory. Neuropsychologia 40: 1737-1743. - PubMed
-
- Bi G, Poo M (2001) Synaptic modification by correlated activity: Hebb's postulate revisited. Annu Rev Neurosci 24: 139-166. - PubMed
Publication types
MeSH terms
Grants and funding
LinkOut - more resources
Full Text Sources
Medical