. 2004 Dec 8;24(49):11137-47.
doi: 10.1523/JNEUROSCI.3524-04.2004.

Global forebrain dynamics predict rat behavioral states and their transitions

Affiliations

Global forebrain dynamics predict rat behavioral states and their transitions

Damien Gervasoni et al. J Neurosci. .

Abstract

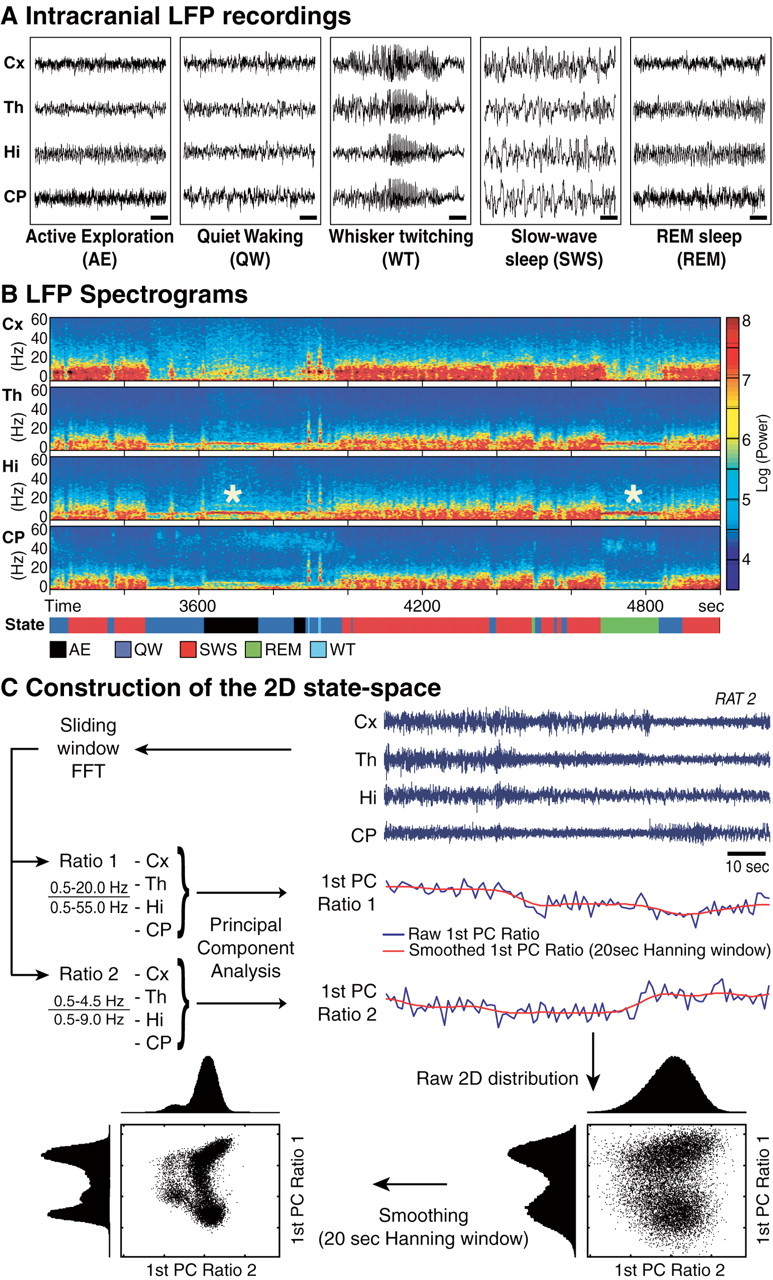
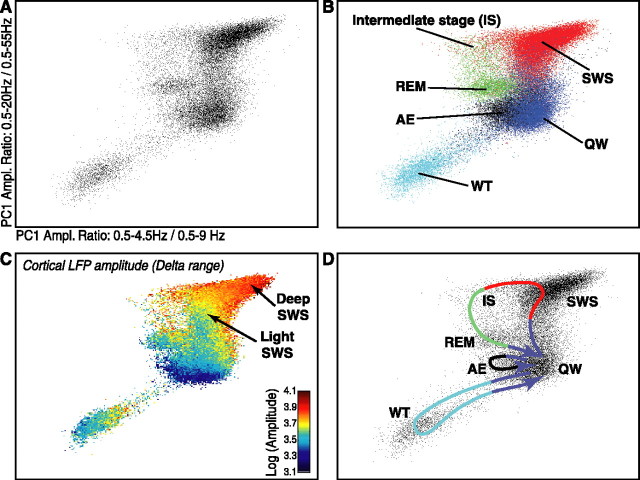
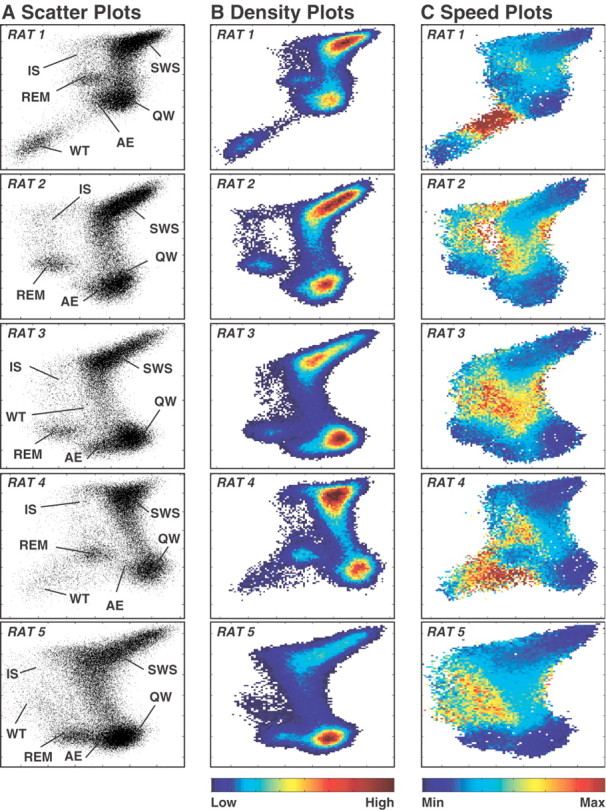
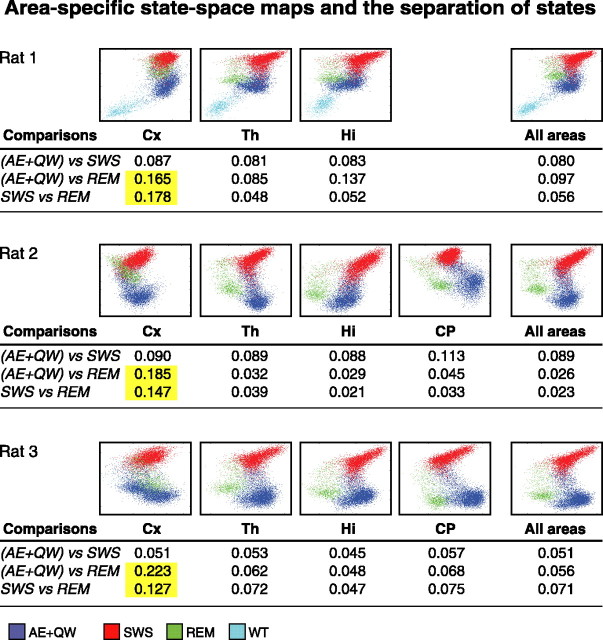
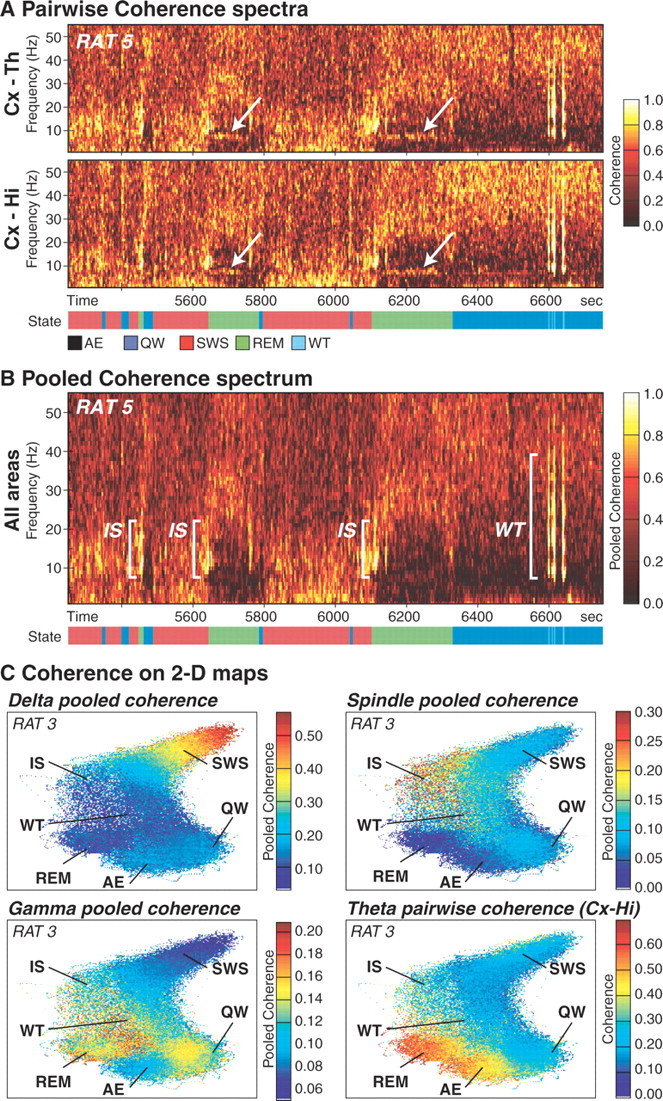
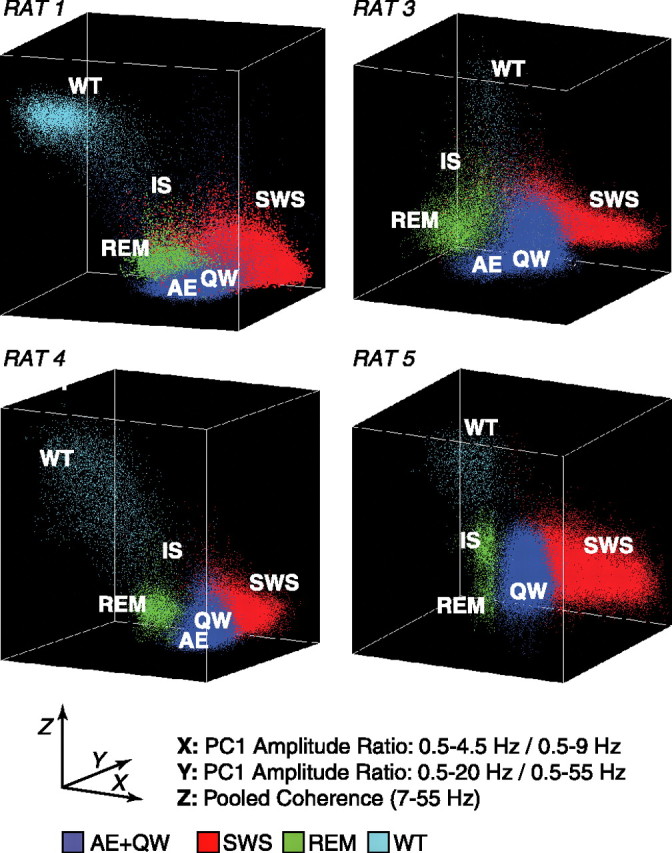
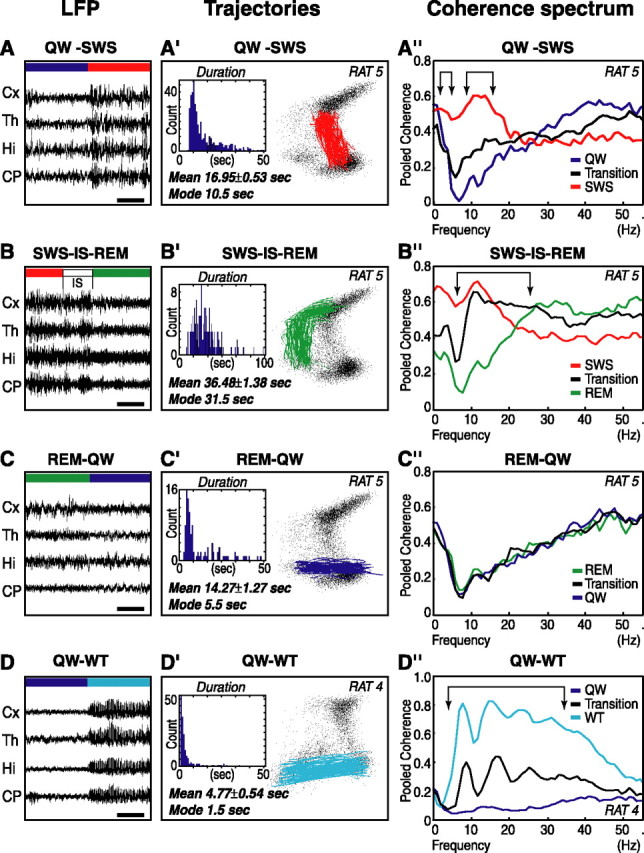
The wake-sleep cycle, a spontaneous succession of global brain states that correspond to major overt behaviors, occurs in all higher vertebrates. The transitions between these states, at once rapid and drastic, remain poorly understood. Here, intracranial local field potentials (LFPs) recorded in the cortex, hippocampus, striatum, and thalamus were used to characterize the neurophysiological correlates of the rat wake-sleep cycle. By way of a new method for the objective classification and quantitative investigation of all major brain states, we demonstrate that global brain state transitions occur simultaneously across multiple forebrain areas as specific spectral trajectories with characteristic path, duration, and coherence bandwidth. During state transitions, striking changes in neural synchronization are effected by the prominent narrow-band LFP oscillations that mark state boundaries. Our results demonstrate that distant forebrain areas tightly coordinate the processing of neural information during and between global brain states, indicating a very high degree of functional integration across the entire wake-sleep cycle. We propose that transient oscillatory synchronization of synaptic inputs, which underlie the rapid switching of global brain states, may facilitate the exchange of information within and across brain areas at the boundaries of very distinct neural processing regimens.


Figures

Figure 1.
Figure 1.
Intracranial local field potentials and behavioral states. A, Raw simultaneous LFP recordings in the four areas of interest. Calibration bar, 1 sec. Five brain states were initially distinguished by visual inspection of LFP traces and behavior. B, LFP power spectrograms, aligned with the color-coded hypnogram, i.e., the temporal sequence of the behavioral states assessed by visual observation of the behavior and inspection of the concurrent LFP features. All areas show simultaneous state-dependent variations of LFP spectral pattern. Notice that AE (black) and REM (green) both show pronounced theta rhythm (white asterisk). C, Construction of the 2-D state space. After elimination of segments with amplitude saturation (representing <1% of the total duration in each rat), a sliding window Fourier transform was applied to each LFP signal to calculate two spectral amplitude ratios. PCA was then applied to these ratios obtained from all LFP channels, and the first PC was used as the overall ratio measure. These measures obtained for each second of data were further smoothed with a Hanning window (20 sec length). Plotted against each other, the two first PCs of spectral ratios define the 2-D state space. Note that clear cluster structures emerged in the 2-D state space after smoothing (the 1-D histogram became more compact after smoothing).
Figure 2.
Figure 2.
Global brain states and two-dimensional state space. A, Scatter plot of the two chosen LFP spectral amplitude ratios, in which four distinct clusters are clearly visible. Each dot corresponds to a 1 sec window for which the amplitude ratios were calculated (48 hr recording, rat 1; for clarity, only one-third of data points, evenly sampled, were plotted). B, When color coded according to the behavioral states visually identified, each cluster in the plot corresponds to a distinct state. C, The amplitude of cortical LFPs in the delta frequency range (1-4 Hz) is color coded. A fine distinction can be made between light SWS (high spindle density) and deep SWS (mostly composed of delta waves). D, Transitions between states can be defined as specific trajectories connecting different clusters, with characteristic duration and speed. Typical trajectories are illustrated. Transitions from SWS to REM always course through the IS region. Trajectories also define the polarity of the different clusters. Entrance to and exit from the SWS cluster always occur on one end of the elongated SWS cluster.
Figure 3.
Figure 3.
The topography of the two-dimensional state spaces is consistent across animals. A, Scatter plots of the 2-D state space (conventions as in Fig. 2 A). For all animals, 48 hr of recording are displayed; to avoid graphic saturation, only 20% of the data points were evenly sampled and plotted. B, Density plots, calculated from the scatter plots, show the conserved cluster topography and the relative abundance of various states (see also Fig. 2 B). C, Speed plots representing the average velocity of spontaneous trajectories within the 2-D state space. Stationarity (low speed) can be observed within the three main clusters, whereas a maximum speed is reached during transitions from one cluster to another (i.e., between brain states).
Figure 4.
Figure 4.
Area-specific state maps. Individual area state maps generated for three rats and color coded for the behavioral state. PCA was used to combine amplitude ratios obtained from different LFPs (rightmost column). Forty-eight hours of data were plotted for each animal (subsampling 1/3 of data for clarity). Rat 1 was not implanted for recording in the CP. Compared with the state space generated by combining LFPs from all areas, all area-specific maps show qualitatively similar separation of major behavioral states, except for cortex-specific maps. This difference was quantified using linear discriminant analysis to assess how well each map separates the various behavioral states based on the visually coded states. The error rates in the tables represent the proportion of misclassification when an optimal linear decision boundary was used to discriminate the two selected states. Only the highlighted combinations (yellow) show >1.7-fold classification error compared with the error rate in the overall state-space map. These high error rate combinations came exclusively from cortex-specific maps in the (AE+QW) versus REM and SWS versus REM comparisons. The results indicate that single-area maps provide as much information as multiple-area pooled maps with regard to state classification. There is therefore a certain redundancy among the forebrain areas studied, with the possible exception of cortex.
Figure 5.
Figure 5.
LFP coherence analysis. A, Examples of pairwise coherence spectrograms illustrating the state-dependent pattern of coupling between Cx and Th (top) and between Cx and Hi (bottom). The spectrograms are aligned with the behavioral state identification (visual coding). Notice that, during REM sleep, both pairs of areas present a high coherence in the theta frequency range (white arrows). B, LFP pooled coherence spectrogram showing the variations of coherence across all areas during the wake-sleep cycle. The highest pooled coherence values are observed in the low frequency range (delta range) during SWS episodes. During WT, animals present typical 7-12 Hz LFP oscillations, and the pooled coherence is greatly increased in this frequency range and its harmonics. The IS state shows high pooled coherence in the 7-22 Hz range. REM and QW have the highest pooled coherence in the gamma range (>30 Hz) but also a low pooled coherence in the theta range, indicating that the four areas present theta oscillations that are not strictly in-phase. C, Coherence measurements over 48 hr of recording are overlaid on the 2-D state map. For delta, spindle, and gamma frequency ranges, pooled coherence is shown. In the theta range, pairwise coherence between Cx and Hi is displayed. High delta pooled coherence values are observed in the right portion of the SWS cluster corresponding to deep SWS, whereas high spindle coherence values are observed during IS and WT (see also Fig.6). High gamma pooled coherence is observed during both REM and QW. The pair Cx-Hi presents high theta coherence during both REM and AE.
Figure 6.
Figure 6.
Pooled coherence, a single measure to address the dynamic of global brain states. 3-D state space in four rats derived from the two amplitude ratios (X- and Y-axes) and the additional average pooled coherence between 7 and 55 Hz (Z-axis). The use of pooled coherence as a single measure of the coupling between forebrain areas captured state-dependent patterns and further improved the separation between states. Notice that the WT cluster can be easily identified.
Figure 7.
Figure 7.
Coherence spectra at state transitions. Four common global brain state transitions of a representative animal are presented with an example of LFP recordings (first column), the corresponding spectral trajectories and their duration within the 2-D state space (second column), and an averaged pooled coherence spectrum for the pre- and post-states and the transition itself (third column). LFP, Recordings of the four areas revealed common oscillatory features and simultaneous changes during state transitions. Calibration bar, 5 sec. Trajectories, Paths connecting major clusters were identified, and histograms of the distribution of duration (insets) were calculated for these trajectories. The average and mode ± SEM of the duration are indicated for this animal (see supplemental Fig. S7, available at www.jneurosci.org as supplemental material). Coherence spectrum, Average coherence spectrum of transitions plotted against the average coherence spectrum of the pre- and post-states, whose points were taken from time points immediately adjacent to the selected trajectories with the same duration as the trajectory. Arrows indicate frequency bands at which significant changes in LFP coherence occur during the transition.

Similar articles

Cited by

References

    1. Achermann P, Borbely AA (1997) Low-frequency (<1 Hz) oscillations in the human sleep electroencephalogram. Neuroscience 81: 213-222. - PubMed
    1. Achermann P, Borbely AA (1998a) Coherence analysis of the human sleep electroencephalogram. Neuroscience 85: 1195-1208. - PubMed
    1. Achermann P, Borbely AA (1998b) Temporal evolution of coherence and power in the human sleep electroencephalogram. J Sleep Res 7 [Suppl 1]: 36-41. - PubMed
    1. Amjad AM, Halliday DM, Rosenberg JR, Conway BA (1997) An extended difference of coherence test for comparing and combining several independent coherence estimates: theory and application to the study of motor units and physiological tremor. J Neurosci Methods 73: 69-79. - PubMed
    1. Amzica F, Steriade M (1995) Short- and long-range neuronal synchronization of the slow (<1 Hz) cortical oscillation. J Neurophysiol 73: 20-38. - PubMed

Publication types