. 2004 Dec 21;101(51):17801-6.
doi: 10.1073/pnas.0406230101. Epub 2004 Dec 10.

Adaptation to fasting by glycerol transport through aquaporin 7 in adipose tissue

Affiliations

Adaptation to fasting by glycerol transport through aquaporin 7 in adipose tissue

Norikazu Maeda et al. Proc Natl Acad Sci U S A. .

Abstract

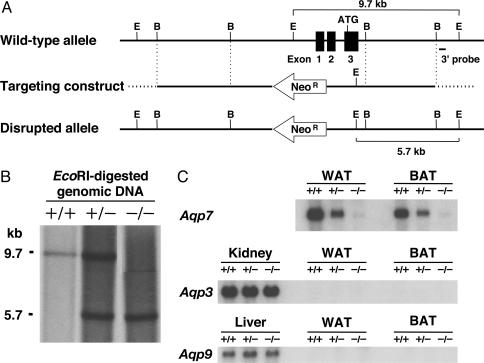
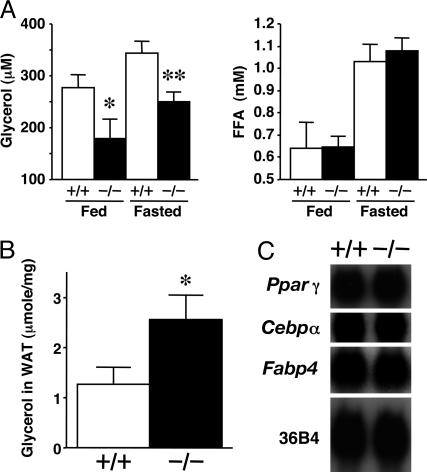
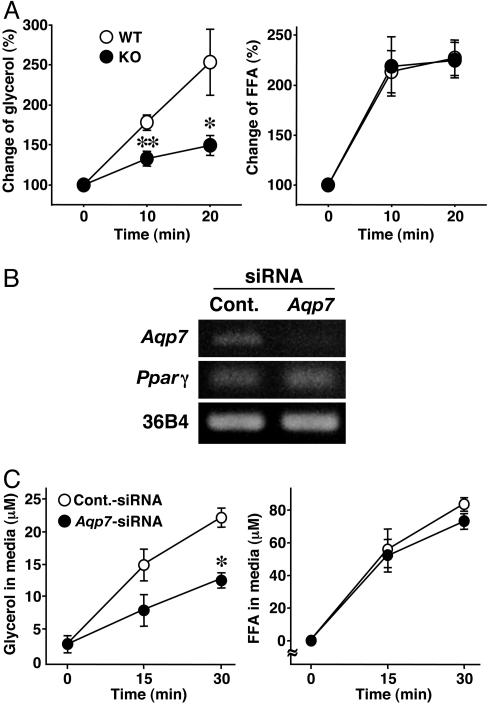
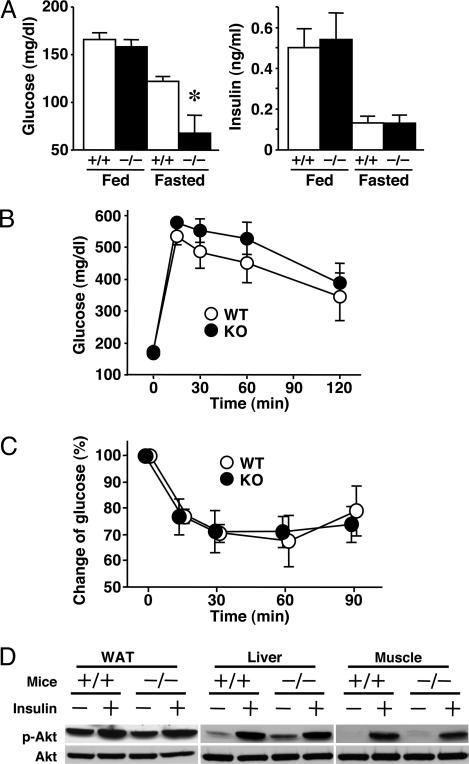
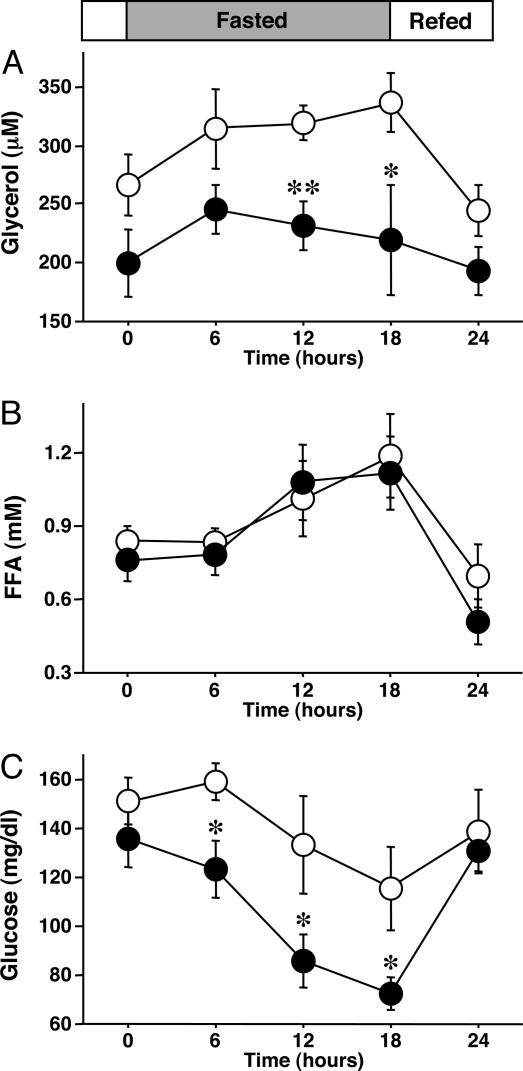
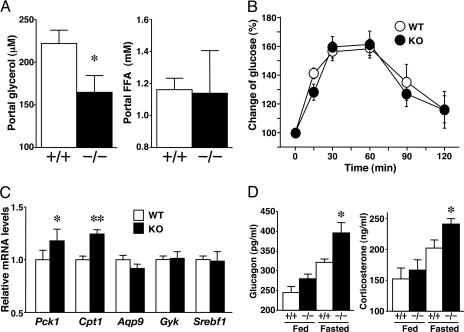
Adipocytes hydrolyze triglycerides and secrete free fatty acids and glycerol into the circulation. The molecular mechanism involved in glycerol transport from adipocytes has not been elucidated. Here, we investigated glycerol and glucose metabolism in mice lacking aquaporin 7 (Aqp7), a member of the aquaglyceroporins expressed in adipose tissue, and demonstrated that Aqp7 functions as a glycerol gateway molecule in vivo. Aqp7-knockout (KO) mice had lower plasma glycerol levels compared with WT mice but had normal plasma free fatty acid levels. The increase in plasma glycerol level in response to beta(3)-adrenergic agonist was severely impaired in KO mice. Epinephrine-stimulated glycerol secretion was also impaired in Aqp7 knockdown adipocytes. During prolonged fasting, plasma glycerol was elevated and the plasma glucose level was maintained in WT mice. In contrast, KO mice showed a disrupted increase of plasma glycerol and rapid reduction of plasma glucose during prolonged fasting. Our findings indicate that the lack of effective glycerol transport from adipocytes by glycerol gateway molecule causes defective adaptation to prolonged fasting.


Figures

Fig. 1.
Fig. 1.
Targeted disruption of the mouse AQP7 gene. (A) Schematic representation of the gene targeting strategy. Partial restriction map of the mouse AQP7 (Aqp7) locus for the WT allele (Top). The targeting construct for Aqp7 was generated by replacing the region of exons 1-3 containing the translation initiation site ATG with the Neo cassette (NeoR) (Middle). The transcriptional direction of the NeoR gene is indicated by the arrow. The expected disrupted allele was obtained by homologous recombination (Bottom). E and B indicate EcoRI and BamHI restriction enzyme sites, respectively. (B) EcoRI-digested genomic Southern blot analysis. The 9.7-kb band corresponds to the WT allele (+/+), and the 5.7-kb corresponds to band to the disrupted allele (-/-), using the probe denoted in A. (C) Northern blotting of WAT, BAT, kidney, and liver. +/+, WT; +/-, heterozygous; -/-, homozygous mice.
Fig. 2.
Fig. 2.
Low plasma glycerol concentrations and high adipose glycerol contents in KO mice. (A) Plasma levels of glycerol and FFA under fed and 12-h-fasted conditions (n = 6 per group). (B) Glycerol content in adipose tissue of 12-h-fasted mice (n = 5-6). (C) Northern blot analysis of mRNAs related to adipogenic marker genes in WAT. +/+, WT; -/-, KO mice. In A and B, data are mean ± SEM. *, P < 0.05; **, P < 0.01, compared with the values of WT mice under the same conditions.
Fig. 3.
Fig. 3.
Impaired glycerol release from Aqp7-KO and -knockdown adipocytes. (A) Lipolysis measurement in vivo. Fed mice were i.p. administered BRL26830A (n = 6-7). Plasma glycerol and FFA levels were normalized to those at 0 min (100%). (B) Knockdown of Aqp7 in 3T3-L1 adipocytes by introducing siRNA. Total RNAs were extracted after a 24-h transfection of siRNA and subjected to RT-PCR. Cont., control. (C) Lipolysis assay in vitro. 3T3-L1 adipocytes transfected with the indicated siRNA were treated with epinephrine (n = 4 per group). +/+, WT; -/-, KO mice. Pparγ, peroxisome proliferator-activated receptor γ. In A and C, data are mean ± SEM. *, P < 0.05; **, P < 0.01, compared with WT mice or control-siRNA.
Fig. 4.
Fig. 4.
Plasma glucose levels and insulin sensitivity in KO mice. (A) Plasma levels of glucose and insulin under fed and 12-h-fasted conditions (n = 6 per group). (B) Glucose curves under the glucose-tolerance test (n = 6-8). (C) Glucose curves under the insulin-tolerance test (n = 6-7). Plasma glucose levels were normalized to those at 0 min (100%). (D) Insulin-stimulated phosphorylation of Akt. Equal amounts of protein from each pooled fraction (n = 5 per group) were immunoblotted with anti-phospho-Akt (Ser-473) and anti-Akt antibodies. +/+, WT mice; -/-, KO mice. In A-C, data are mean ± SEM. *, P < 0.05, compared with the values of WT mice under the same conditions.
Fig. 5.
Fig. 5.
Fasting-induced hypoglycemia in KO mice. Mice were fasted for 18 h after a 12-h feeding (n = 6 per group). Shown is the effect of long fasting on plasma glycerol (A), FFA (B), and glucose (C). Data are mean ± SEM. *, P < 0.05; **, P < 0.01, compared with WT mice.
Fig. 6.
Fig. 6.
Liver gluconeogenesis in KO mice. (A) Plasma glycerol and FFA levels in the portal vein of 12-h-fasted mice (n = 6 per group). (B) Rate of glucose clearance after exogenous glycerol administration (n = 5 per group). Plasma glucose levels were normalized to those at 0 min (100%). (C) mRNA levels in liver of 12-h-fasted mice (n = 6 per group). (D) Plasma glucagon and corticosterone concentrations under fed and 12-h-fasted conditions (n = 6 per group). +/+, WT; -/-, KO. Pck1, phosphoenolpyruvate carboxykinase 1; Gyk, glycerol kinase; Srebf1, sterol regulatory element-binding factor 1. In all panels, data are mean ± SEM. *, P < 0.05; **, P < 0.01, compared with WT mice.

References

    1. Denker, B. M., Smith, B. L., Kuhajda, F. P. & Agre, P. (1988) J. Biol. Chem. 263, 15634-15642. - PubMed
    1. Verkman, A. S. (2002) J. Anat. 200, 617-627. - PMC - PubMed
    1. Agre, P. & Kozono, D. (2003) FEBS Lett. 555, 72-78. - PubMed
    1. Preston, G. M., Carroll, T. P., Guggino, W. B. & Agre, P. (1992) Science 256, 385-387. - PubMed
    1. Giles, J. (2003) Nature 425, 651. - PubMed

Publication types