. 2004 Dec 21;101(51):17640-5.
doi: 10.1073/pnas.0408116101. Epub 2004 Dec 10.

A quantitative assessment of models for voltage-dependent gating of ion channels

Affiliations

A quantitative assessment of models for voltage-dependent gating of ion channels

Michael Grabe et al. Proc Natl Acad Sci U S A. .

Erratum in

  • Proc Natl Acad Sci U S A. 2005 Jul 26;102(30):10753

Abstract

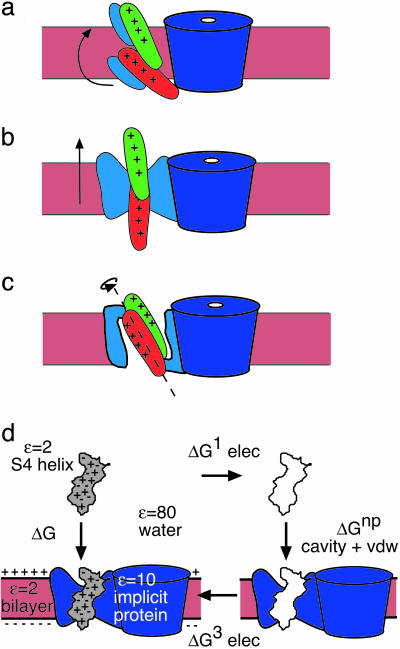
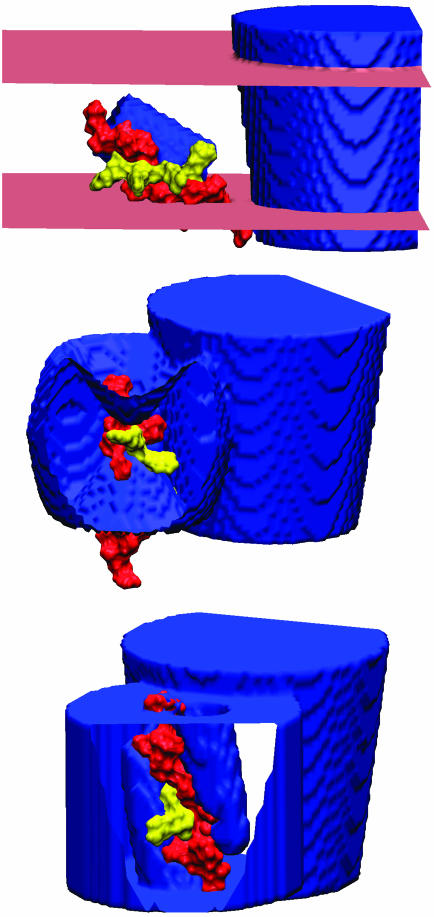
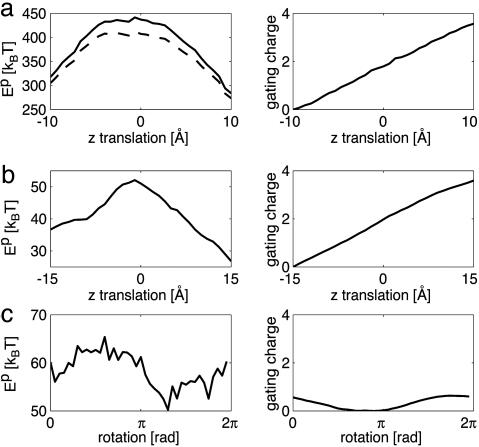
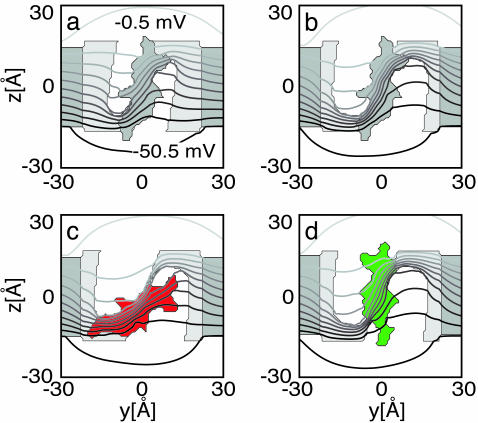
Voltage-gated ion channels open and close, or "gate," in response to changes in membrane potential. The electric field across the membrane-protein complex exerts forces on charged residues driving the channel into different functional conformations as the membrane potential changes. To act with the greatest sensitivity, charged residues must be positioned at key locations within or near the transmembrane region, which requires desolvating charged groups, a process that can be energetically prohibitive. Although there is good agreement on which residues are involved in this process for voltage-activated potassium channels, several different models of the sensor geometry and gating motions have been proposed. Here we incorporate low-resolution structural information about the channel into a Poisson-Boltzmann calculation to determine solvation barrier energies and gating charge values associated with each model. The principal voltage-sensing helix, S4, is represented explicitly, whereas all other regions are represented as featureless, dielectric media with complex boundaries. From our calculations, we conclude that a pure rotation of the S4 segment within the voltage sensor is incapable of producing the observed gating charge values, although this shortcoming can be partially remedied by first tipping and then minimally translating the S4 helix. Models in which the S4 segment has substantial interaction with the low-dielectric environment of the membrane incur solvation energies of hundreds of k(B)T, and activation times based on these energies are orders of magnitude slower than experimentally observed.


Figures

Fig. 1.
Fig. 1.
Three models of voltage sensor geometries and gating motions and the thermodynamic cycle for helix insertion. (a) Lipid-exposed model. (b) Pure translation model. (c) Pure rotation model. The S4 helix is drawn in the down (red) and up (green) states. The central pore is dark blue, the implicit voltage sensor helices S1–S3 are light blue, and the membrane is pink. (d) ΔGG1 + ΔG3 + ΔGnp is the total solvation energy. -ΔG1 is the energy required to charge S4 in solution, and ΔG3 is the energy required to charge S4 in the membrane–protein complex under an applied electric field. The energy required to move a neutral molecule out of solution is the sum of the cavity and van der Waals (vdw) terms, ΔGnp, jointly referred to as the hydrophobic effect.
Fig. 2.
Fig. 2.
The central pore and a single voltage sensor corresponding to lipid-exposed (Top), translation (Middle), and rotation (Bottom) models from Fig. 1. All models show the S4 helix in the down state (red) with the top four charged groups colored yellow. (Top) The membrane–solution interface (pink) forms a plane. (Middle and Bottom) Cutaway views of the sensor show the portions of S4 surrounded by protein. (Bottom) The finger-like water vestibules on either side of S4 allow water access to the helix. Images were created with vmd (33).
Fig. 3.
Fig. 3.
Total electrostatic solvation energy of the S4 segment and gating charge movement for lipid-exposed (a), translation (b), and rotation (c) models. (Left) Plots of the solvation energy. (Right) Plots of the total gating charge along the reaction pathway. The dashed curve represents the effect of the S3b helix on the lipid-exposed model. The solvation energy profile for the rotation model is rugged because of the complicated interfacial geometry.
Fig. 4.
Fig. 4.
Membrane potential profile across the rotation model sensor. The system is divided into three distinct regions: water (white, ε = 80), voltage sensor (light gray, ε = 10), explicit S4 helix, and membrane (dark gray, ε = 2). The electrostatic potential was generated by solving Eq. 1 in the absence of protein charges with Vin =-2.0 kBT (approximately -51.4 mV). Equipotential lines are superimposed over the sensor geometry every 5 mV. (a) The standard rotation model. (b) The mouth of the vestibule has been increased to 21 Å. (c and d) Two configurations of a modified gating movement in which S4 starts in the down state (red), rotates by π radians, tips across the septum separating the inner and outer vestibules, and is translated into the up state (green).
Fig. 5.
Fig. 5.
Electrostatic energy required to expose S4 to membrane. The S4 segment (center of Inset) was wrapped in an intermediate-dielectric region (ε = 10.0) and then exposed to low-dielectric wedges (ε = 2.0). The solid angle of the wedge was increased from 0 to π/2, and the electrostatic energy with respect to the nonexposed state was plotted for the charge carrying side (solid curve) or the hydrophobic side (dashed curve) facing the wedge. (Inset) Top-down view of sensor configurations for solid angles 3π/8 (explicit) and π/2 (schematic). The angular extent of the lipid wedge is indicated by curved arrows. The explicit diagram shows the red, 2.01 isocontour of the dielectric map corresponding to the membrane and S4 helix. The surrounding sensor and central pore are black.

References

    1. Seoh, S. A., Sigg, D., Papazian, D. M. & Bezanilla, F. (1996) Neuron 16, 1159–1167. - PubMed
    1. Aggarwal, S. K. & MacKinnon, R. (1996) Neuron 16, 1169–1177. - PubMed
    1. Catterall, W. A. (1986) Annu. Rev. Biochem. 55, 953–985. - PubMed
    1. Guy, H. R. & Seetharamulu, P. (1986) Proc. Natl. Acad. Sci. USA 83, 508–512. - PMC - PubMed
    1. Cha, A., Snyder, G. E., Selvin, P. R. & Bezanilla, F. (1999) Nature 402, 809–813. - PubMed

Publication types

LinkOut - more resources