Comparative Study
. 2004 Dec 21;101(51):17765-70.
doi: 10.1073/pnas.0407979101. Epub 2004 Dec 10.

Comparative genomic hybridization using oligonucleotide microarrays and total genomic DNA

Affiliations
Comparative Study

Comparative genomic hybridization using oligonucleotide microarrays and total genomic DNA

Michael T Barrett et al. Proc Natl Acad Sci U S A. .

Abstract

Array-based comparative genomic hybridization (CGH) measures copy-number variations at multiple loci simultaneously, providing an important tool for studying cancer and developmental disorders and for developing diagnostic and therapeutic targets. Arrays for CGH based on PCR products representing assemblies of BAC or cDNA clones typically require maintenance, propagation, replication, and verification of large clone sets. Furthermore, it is difficult to control the specificity of the hybridization to the complex sequences that are present in each feature of such arrays. To develop a more robust and flexible platform, we created probe-design methods and assay protocols that make oligonucleotide microarrays synthesized in situ by inkjet technology compatible with array-based comparative genomic hybridization applications employing samples of total genomic DNA. Hybridization of a series of cell lines with variable numbers of X chromosomes to arrays designed for CGH measurements gave median ratios for X-chromosome probes within 6% of the theoretical values (0.5 for XY/XX, 1.0 for XX/XX, 1.4 for XXX/XX, 2.1 for XXXX/XX, and 2.6 for XXXXX/XX). Furthermore, these arrays detected and mapped regions of single-copy losses, homozygous deletions, and amplicons of various sizes in different model systems, including diploid cells with a chromosomal breakpoint that has been mapped and sequenced to a precise nucleotide and tumor cell lines with highly variable regions of gains and losses. Our results demonstrate that oligonucleotide arrays designed for CGH provide a robust and precise platform for detecting chromosomal alterations throughout a genome with high sensitivity even when using full-complexity genomic samples.


Figures
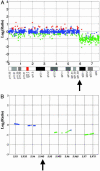
Fig. 4.
Fig. 4.
Detection and mapping of single-copy intrachromosomal losses on chromosome 18q with CGH arrays. (A) The log2 ratios of the 3,293 chromosome-18 probes are plotted as a function of chromosomal position (×10 Mb) for hybridization of the GM50122 18q-cell line to the CGH array using a 50-kb moving average. Regions of loss (green), gain (red), and no change (blue) were color-coded by using a noise model based on six independent hybridizations with samples containing normal chromosome 18 with the CGH array (see Materials and Methods). (B) Localized view of breakpoint region on 18q21.3. Arrows indicate the nucleotide position (59,462,941) of the defined breakpoint in this cell line. The minimum error rate for detection of single-copy deletions of 18q21.3-qtel sequences in GM50122 versus XX hybridizations was 9% for the 637 18q probes that mapped distal to the breakpoint region on the CGH arrays. Data for GM050122 are given in Data Sets 23 and 24, which are published as supporting information on the PNAS web site.
Fig. 5.
Fig. 5.
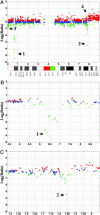
Detection of homozygous deletions in HCT116 colon carcinoma cells with CGH arrays. (A) The log2 ratios of the 5464 chromosome-16 probes are plotted as a function of chromosomal position using a 50-kb weighted moving average. Regions of loss (green), gain (red), and no change (blue) were color-coded by using a noise model based on eight independent hybridizations with samples containing normal chromosome 16 with the CGH array (see Materials and Methods). The known homozygous deletions at the (1) A2BP1 (16p) and (2) FRA16D (16q) loci are shown. (B and C) Localized view of 16p homozygous deletion (B) and 16q homozygous deletion (C). Also, loss of terminal 16p (3) and duplication of terminal 16q (4) were detected. Data sets for HCT116 are given in Data Sets 25 and 26, which are published as supporting information on the PNAS web site.
Fig. 6.
Fig. 6.
Detection of complex chromosome-17 rearrangements in MDA-MB-453 cells with CGH arrays. The log2 ratios of the 7,723 chromosome-17 probes are plotted as a function of chromosomal position by using a 50-kb weighted moving average. (A) Regions of loss (green), gain (red), and no change (blue) in MDA-MB-453 cells were color-coded by using a noise model based on eight independent hybridizations of samples containing normal chromosome-17 (see Materials and Methods). Loss of 17p that spans the TP53 locus (p13.1) was observed. Also, distinct regions of amplification and loss were detected on the q arm. (B) Representative example of log2 ratios for chromosome-17 probes in a 46,XX self/self hybridization. Complete data sets for MDA-MB-453 and 46,XX self/self are given in Data Sets 27 and 28, which are published as supporting information on the PNAS web site.
Fig. 1.
Fig. 1.
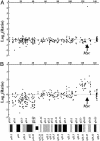
Detection of copy-number variations in tumor cell lines with expression arrays. The log2 ratios of the 292 probes mapped on chromosome 8 that represent unique genomic sequences and had mean signals in the reference channel greater than three standard deviations above the mean of the negative control feature signals are plotted for COLO 320DM (A) and HT 29 (B) colorectal carcinoma cell lines as a function of chromosomal position with no moving averages. Previously characterized genomic lesions including high-level amplification of MYC in COLO 320DM and simultaneous 8p deletion and amplification of 8q in HT 29 cells were observed. Complete data for COLO 320DM and HT 29 are given in Data Sets 1-4 and Figs. 7 and 8, which are published as supporting information on the PNAS web site.
Fig. 2.
Fig. 2.
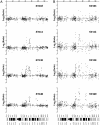
Detection of copy-number variations in sarcoma tissues with cDNA and oligonucleotide expression arrays. Log2 ratios are plotted with no moving average as a function of chromosomal position (Mb) for the cDNA (A) and oligonucleotide (B) arrays, showing detection of amplified regions in ST112, ST130, and ST240. The custom cDNA arrays contained PCR products representing 511 clones mapped to chromosome 12 (26). The oligonucleotide-array data plots include ratios from 399 oligonucleotide probes from chromosome 12 that represent unique genomic sequences and had mean signals in the reference channel greater than three standard deviations above the mean of the negative-control feature signals. Data sets for chromosome-12 probes on the oligonucleotide arrays for the four sarcoma patient samples are given in Data Sets 9-12, which are published as supporting information on the PNAS web site.
Fig. 3.
Fig. 3.
Performance of expression and CGH arrays for detecting varying copy numbers of the X chromosome. Distributions and medians (dashed lines) of log2 ratios from X-chromosome oligonucleotide probes in XY/XX (blue), XX/XX (green), XXX/XX (red), XXXX/XX (teal), and XXXXX/XX (purple) hybridizations on expression (A) and CGH (C) arrays. Measured mean (open circles) and median (filled circles) fluorescence ratios of X-chromosome probes are plotted versus theoretical ratios for the expression (B) and CGH (D) arrays. Error bars represent the standard deviation for each median value. Median fluorescence ratios were as follows: 0.7 (XY/XX), 1.0 (XX/XX), 1.1 (XXX/XX), 1.3 (XXXX/XX), and 1.7 (XXXXX/XX) for the expression array; and 0.5 (XY/XX), 1.0 (XX/XX), 1.4 (XXX/XX), 2.1 (XXXX/XX), and 2.6 (XXXXXXX) for the CGH arrays. The expression arrays contain 644 X-chromosome probes designed for transcriptional analysis. A total of 269 of these X-chromosome probes failed the homology filter, and another two X-chromosome probes failed the low-signal filter. Thus, each expression-array plot includes 373 X-chromosome probes representing unique genomic sequences that gave signal intensities at least three standard deviations above the average of negative control feature signals. CGH array plots include all of the 4,878 chromosome-X probes on these arrays. The minimum error rate for detection of single copy deletions of X-chromosome sequences in XY versus XX hybridizations was 21% for the 373 filtered X-chromosome probes on the expression arrays and 5% for the 4,878 X-chromosome probes on the CGH arrays. X-chromosome probe sequences and complete data sets for expression arrays and CGH arrays from the five X-series cell lines and cumulative frequency distributions for the CGH arrays are given in Tables 1 and 2, Data Sets 13-22, and Fig. 12 which are published as supporting information on the PNAS web site.

References

    1. Pinkel, D., Segraves, R., Sudar, D., Clark, S., Poole, I., Kowbel, D., Collins, C., Kuo, W. L., Chen, C., Zhai, Y., et al. (1998) Nat. Genet. 20, 207-211. - PubMed
    1. Pollack, J. R., Perou, C. M., Alizadeh, A. A., Eisen, M. B., Pergamenschikov, A., Williams, C. F., Jeffrey, S. S., Botstein, D. & Brown, P. O. (1999) Nat. Genet. 23, 41-46. - PubMed
    1. Snijders, A. M., Nowak, N., Segraves, R., Blackwood, S., Brown, N., Conroy, J., Hamilton, G., Hindle, A. K., Huey, B., Kimura, K., et al. (2001) Nat. Genet. 29, 263-264. - PubMed
    1. Greshock, J., Naylor, T. L., Margolin, A., Diskin, S., Cleaver, S. H., Futreal, P. A., deJong, P. J., Zhao, S., Liebman, M. & Weber, B. L. (2004) Genome Res. 14, 179-187. - PMC - PubMed
    1. Hodgson, G., Hager, J. H., Volik, S., Hariono, S., Wernick, M., Moore, D., Nowak, N., Albertson, D. G., Pinkel, D., Collins, C., et al. (2001) Nat. Genet. 29, 459-464. - PubMed

Publication types