

Reasoning of spike glycoproteins being more vulnerable to mutations among 158 coronavirus proteins from different species
- PMID: 15592899
- PMCID: PMC7088192
- DOI: 10.1007/s00894-004-0210-0
Reasoning of spike glycoproteins being more vulnerable to mutations among 158 coronavirus proteins from different species
Abstract
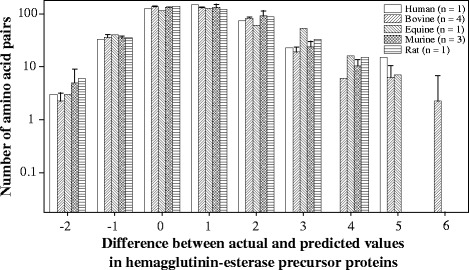
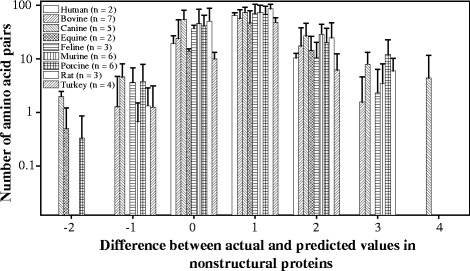
In this study, we used the probabilistic models developed by us over the last several years to analyze 158 proteins from coronaviruses in order to determine which protein is more vulnerable to mutations. The results provide three lines of evidence suggesting that the spike glycoprotein is different from the other coronavirus proteins: (1) the spike glycoprotein is more sensitive to mutations, this is the current state of the spike glycoprotein, (2) the spike glycoprotein has undergone more mutations in the past, this is the history of spike glycoprotein, and (3) the spike glycoprotein has a bigger potential towards future mutations, this is the future of spike glycoprotein. Furthermore, this study gives a clue on the species susceptibility regarding different proteins.
Figures

Similar articles
-
2-D graphical representation of protein sequences and its application to coronavirus phylogeny.BMB Rep. 2008 Mar 31;41(3):217-22. doi: 10.5483/bmbrep.2008.41.3.217. BMB Rep. 2008. PMID: 18377725
-
Cloning and sequence analysis of the spike gene from several feline coronaviruses.Adv Exp Med Biol. 1993;342:17-21. doi: 10.1007/978-1-4615-2996-5_3. Adv Exp Med Biol. 1993. PMID: 8209725
-
Intracellular transport of the S proteins of coronaviruses.Adv Exp Med Biol. 2006;581:271-5. doi: 10.1007/978-0-387-33012-9_45. Adv Exp Med Biol. 2006. PMID: 17037541 Free PMC article. No abstract available.
-
Receptor specificity and receptor-induced conformational changes in mouse hepatitis virus spike glycoprotein.Adv Exp Med Biol. 2001;494:173-81. doi: 10.1007/978-1-4615-1325-4_29. Adv Exp Med Biol. 2001. PMID: 11774465 Review. No abstract available.
-
Coronavirus spike proteins in viral entry and pathogenesis.Virology. 2001 Jan 20;279(2):371-4. doi: 10.1006/viro.2000.0757. Virology. 2001. PMID: 11162792 Free PMC article. Review. No abstract available.
Cited by
-
Mutation trend of hemagglutinin of influenza A virus: a review from a computational mutation viewpoint.Acta Pharmacol Sin. 2006 May;27(5):513-26. doi: 10.1111/j.1745-7254.2006.00329.x. Acta Pharmacol Sin. 2006. PMID: 16626505 Free PMC article. Review.
-
An effective CTL peptide vaccine for Ebola Zaire Based on Survivors' CD8+ targeting of a particular nucleocapsid protein epitope with potential implications for COVID-19 vaccine design.Vaccine. 2020 Jun 9;38(28):4464-4475. doi: 10.1016/j.vaccine.2020.04.034. Epub 2020 Apr 28. Vaccine. 2020. PMID: 32418793 Free PMC article.
-
Design of novel viral attachment inhibitors of the spike glycoprotein (S) of severe acute respiratory syndrome coronavirus-2 (SARS-CoV-2) through virtual screening and dynamics.Int J Antimicrob Agents. 2020 Dec;56(6):106177. doi: 10.1016/j.ijantimicag.2020.106177. Epub 2020 Sep 25. Int J Antimicrob Agents. 2020. PMID: 32987103 Free PMC article.
-
Prediction of mutations engineered by randomness in H5N1 hemagglutinins of influenza A virus.Amino Acids. 2008 Aug;35(2):365-73. doi: 10.1007/s00726-007-0602-4. Epub 2007 Nov 2. Amino Acids. 2008. PMID: 17973072 Free PMC article.
-
Analysis of preferred codon usage in the coronavirus N genes and their implications for genome evolution and vaccine design.J Virol Methods. 2020 Mar;277:113806. doi: 10.1016/j.jviromet.2019.113806. Epub 2020 Jan 5. J Virol Methods. 2020. PMID: 31911390 Free PMC article.
References
-
- Hu LD, Zheng GY, Jiang HS, Xia Y, Zhang Y, Kong XY. Acta Pharmacol Sin. 2003;24:741–745. - PubMed
-
- Siddell SG. The coronaviridae: an introduction. New York: Plenum; 1995. pp. 1–10.
MeSH terms
Substances
LinkOut - more resources
Full Text Sources
Miscellaneous
