

Nuclear DNA content estimates in multicellular green, red and brown algae: phylogenetic considerations
- PMID: 15596456
- PMCID: PMC4246707
- DOI: 10.1093/aob/mci002
Nuclear DNA content estimates in multicellular green, red and brown algae: phylogenetic considerations
Abstract
Background and aims: Multicellular eukaryotic algae are phylogenetically disparate. Nuclear DNA content estimates have been published for fewer than 1 % of the described species of Chlorophyta, Phaeophyta and Rhodophyta. The present investigation aims to summarize the state of our knowledge and to add substantially to our database of C-values for theses algae.
Methods: The DNA-localizing fluorochrome DAPI (4', 6-diamidino-2-phenylindole) and RBC (chicken erythrocyte) standard were used to estimate 2C values with static microspectrophotometry.
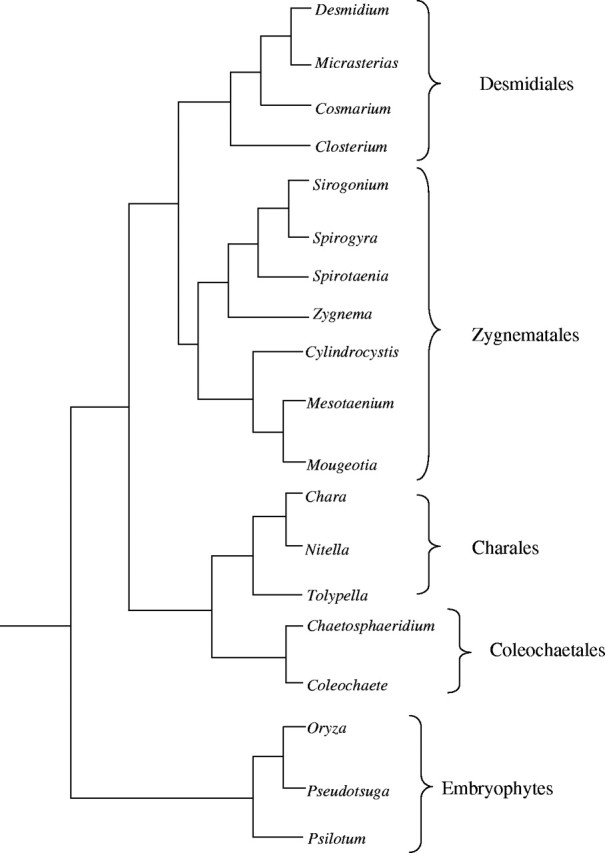
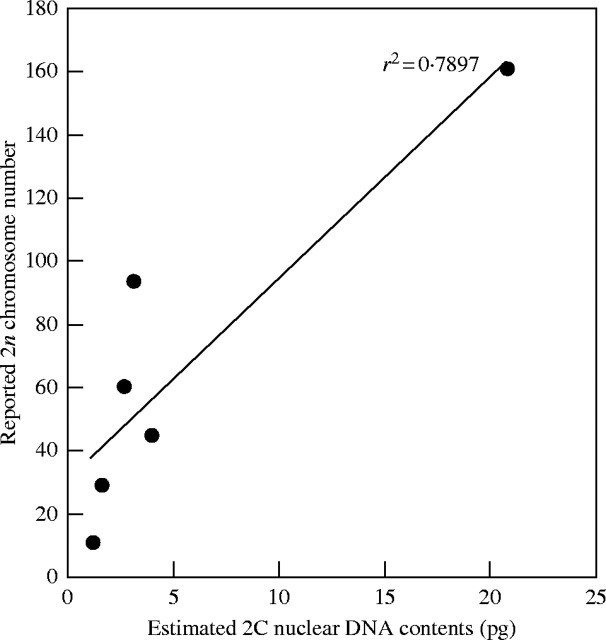
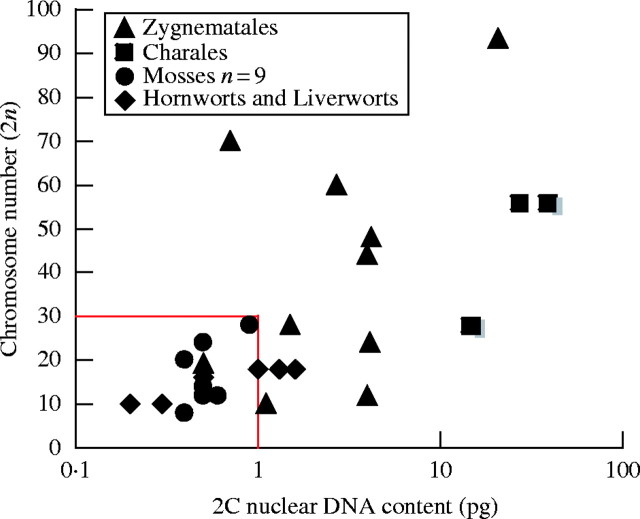
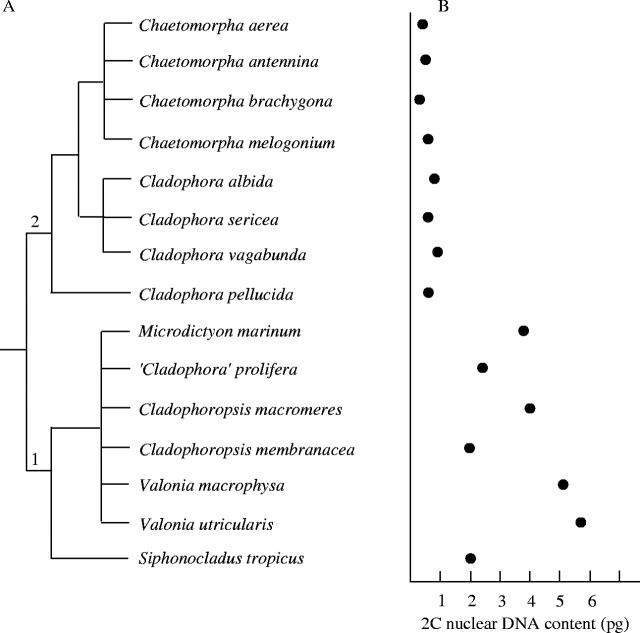
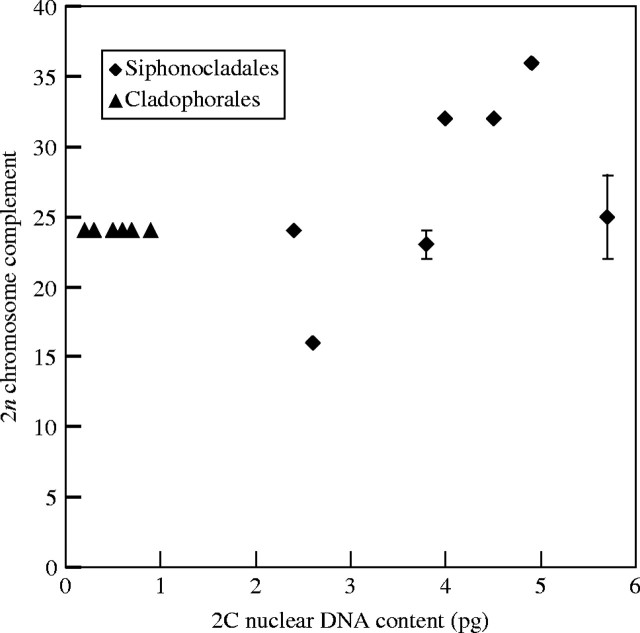
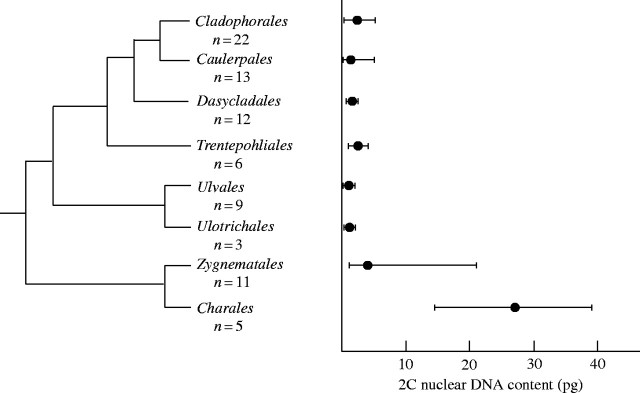
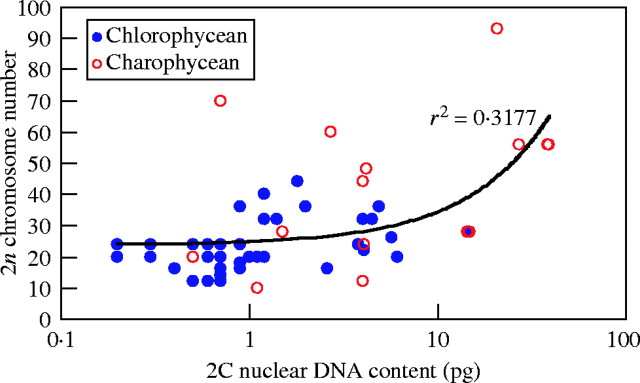
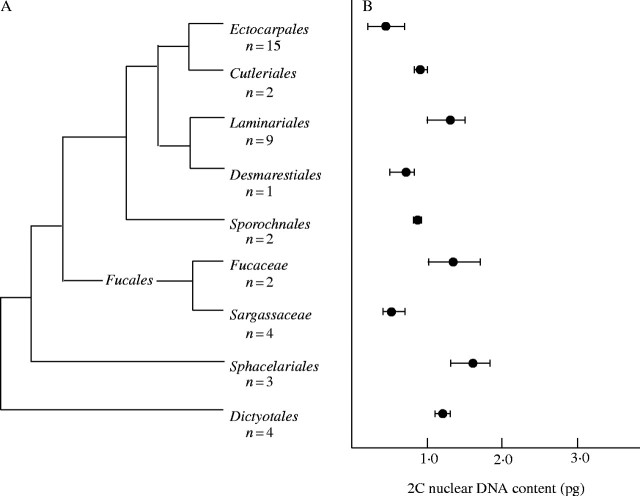
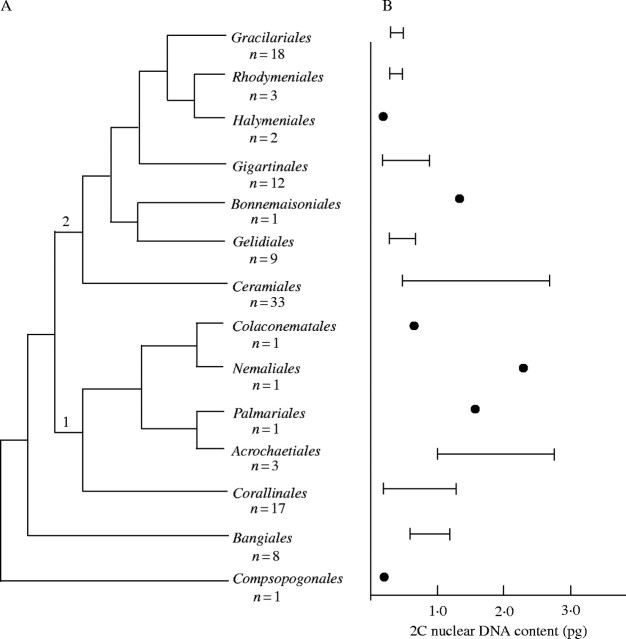
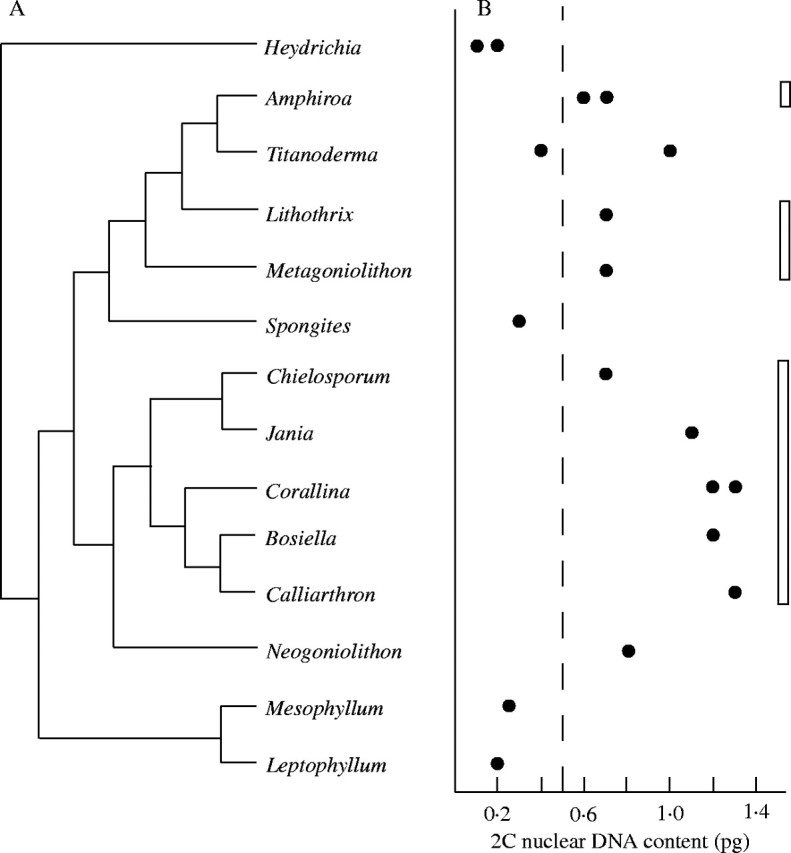
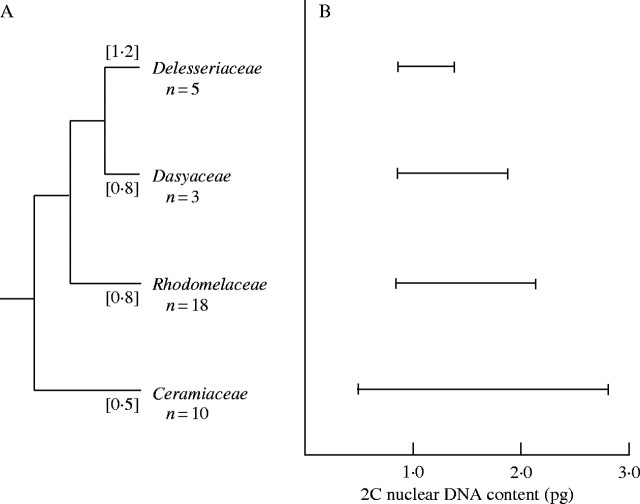
Key results: 2C DNA contents for 85 species of Chlorophyta range from 0.2-6.1 pg, excluding the highly polyploidy Charales and Desmidiales with DNA contents of up to 39.2 and 20.7 pg, respectively. 2C DNA contents for 111 species of Rhodophyta range from 0.1-2.8 pg, and for 44 species of Phaeophyta range from 0.2-1.8 pg.
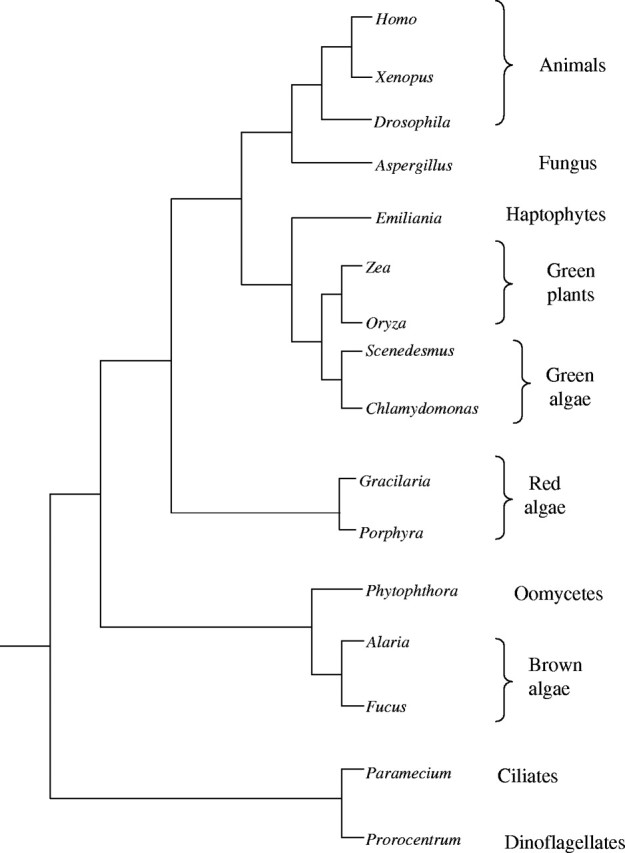
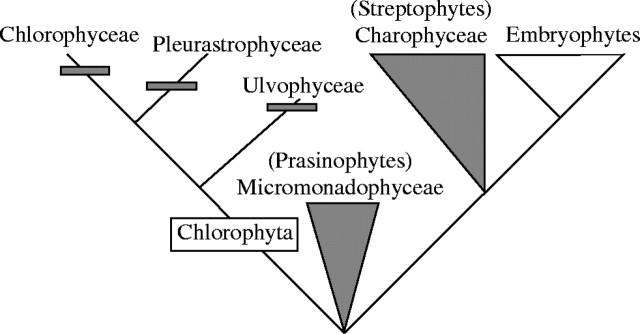
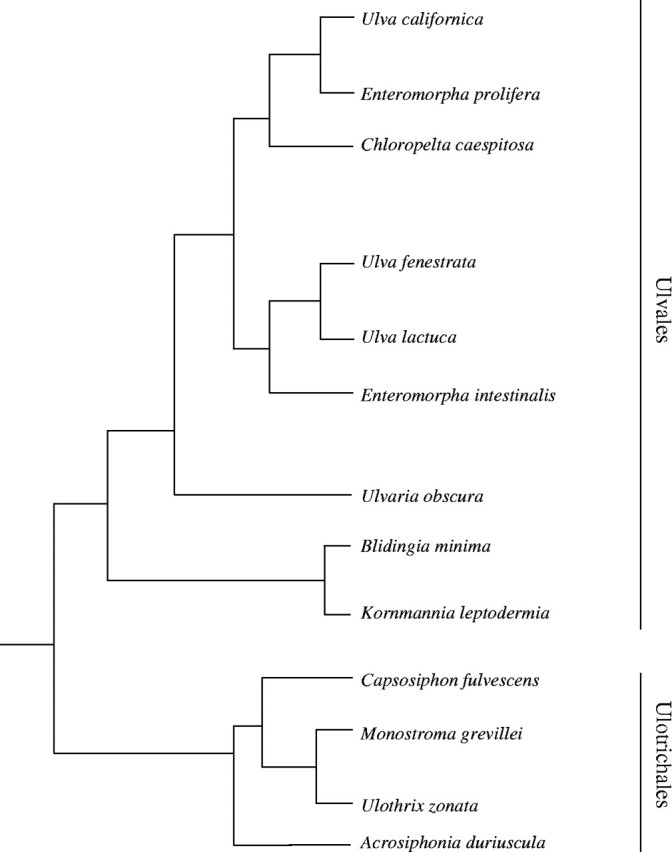
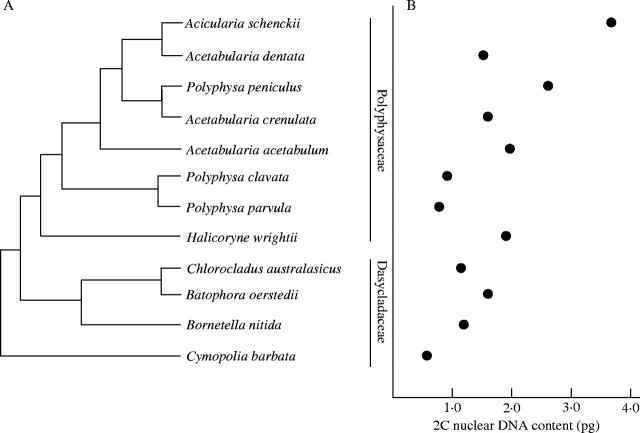
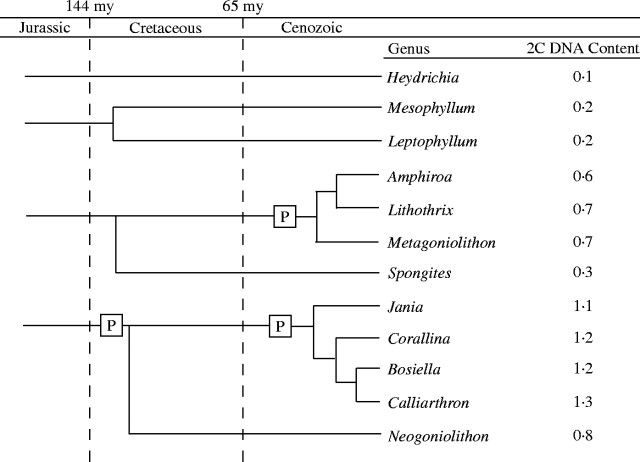
Conclusions: New availability of consensus higher-level molecular phylogenies provides a framework for viewing C-value data in a phylogenetic context. Both DNA content ranges and mean values are greater in taxa considered to be basal. It is proposed that the basal, ancestral genome in each algal group was quite small. Both mechanistic and ecological processes are discussed that could have produced the observed C-value ranges.
Figures
Similar articles
-
Nuclear DNA content estimates in green algal lineages: chlorophyta and streptophyta.Ann Bot. 2007 Apr;99(4):677-701. doi: 10.1093/aob/mcl294. Epub 2007 Feb 1. Ann Bot. 2007. PMID: 17272304 Free PMC article.
-
Nuclear DNA content variation in life history phases of the Bonnemasoniaceae (Rhodophyta).PLoS One. 2014 Jan 22;9(1):e86006. doi: 10.1371/journal.pone.0086006. eCollection 2014. PLoS One. 2014. PMID: 24465835 Free PMC article.
-
Estimates of nuclear DNA content in 98 species of brown algae (Phaeophyta).AoB Plants. 2011;2011:plr001. doi: 10.1093/aobpla/plr001. Epub 2011 Jan 18. AoB Plants. 2011. PMID: 22476472 Free PMC article.
-
[Advances on the genome of algae].Yi Chuan. 2013 Jun;35(6):735-44. doi: 10.3724/sp.j.1005.2013.00735. Yi Chuan. 2013. PMID: 23774018 Review. Chinese.
-
Do red and green make brown?: perspectives on plastid acquisitions within chromalveolates.Eukaryot Cell. 2011 Jul;10(7):856-68. doi: 10.1128/EC.00326-10. Epub 2011 May 27. Eukaryot Cell. 2011. PMID: 21622904 Free PMC article. Review.
Cited by
-
Mediterranean species of Caulerpa are polyploid with smaller genomes in the invasive ones.PLoS One. 2012;7(10):e47728. doi: 10.1371/journal.pone.0047728. Epub 2012 Oct 22. PLoS One. 2012. PMID: 23110095 Free PMC article.
-
Genome structure and metabolic features in the red seaweed Chondrus crispus shed light on evolution of the Archaeplastida.Proc Natl Acad Sci U S A. 2013 Mar 26;110(13):5247-52. doi: 10.1073/pnas.1221259110. Epub 2013 Mar 15. Proc Natl Acad Sci U S A. 2013. PMID: 23503846 Free PMC article.
-
Combining morphology, behaviour and genomics to understand the evolution and ecology of microbial eukaryotes.Philos Trans R Soc Lond B Biol Sci. 2019 Nov 25;374(1786):20190085. doi: 10.1098/rstb.2019.0085. Epub 2019 Oct 7. Philos Trans R Soc Lond B Biol Sci. 2019. PMID: 31587641 Free PMC article. Review.
-
The effect of nutrient enrichment on the growth, nucleic acid concentrations, and elemental stoichiometry of coral reef macroalgae.Ecol Evol. 2012 Aug;2(8):1985-95. doi: 10.1002/ece3.330. Epub 2012 Jul 16. Ecol Evol. 2012. PMID: 22957199 Free PMC article.
-
Eukaryotic genome size databases.Nucleic Acids Res. 2007 Jan;35(Database issue):D332-8. doi: 10.1093/nar/gkl828. Epub 2006 Nov 7. Nucleic Acids Res. 2007. PMID: 17090588 Free PMC article.
References
-
- Adey WH, Johansen HW.1972. Morphology and taxonomy of corallinaceae with special reference to Clathromorphum, Mesophyllum, and Neopolyprolithon gen. nov. (Rhodophyceae, Cryptonemiales). Phycologia 11: 159–180.
-
- Adey WH, Macintyre IG.1973. Crustose coralline algae: a re-evaluation in the geological sciences. Bulletin of the Geologic Society of America 84: 883–904.
-
- Alexopoulos CJ, Bold HC.1967.Algae and fungi. New York: Macmillan Company.
-
- Bachman K, Goin OB, Goin CJ.1972. Nuclear DNA amounts in vertebrates. Brookhaven Symposia in Biology 23: 419–450. - PubMed
-
- Bailey JC.1999. Phylogenetic positions of Lithophyllum incrustans and Titanoderma pustulatum (Corallinaceae, Rhodophyta) based on 18S rRNA gene sequence analyses, with a revised classification of the Lithophylloideae. Phycologia 38: 208–216.
Publication types
MeSH terms
Substances
LinkOut - more resources
Full Text Sources
Other Literature Sources
