

Evolution of DNA amounts across land plants (embryophyta)
- PMID: 15596468
- PMCID: PMC4246719
- DOI: 10.1093/aob/mci014
Evolution of DNA amounts across land plants (embryophyta)
Abstract
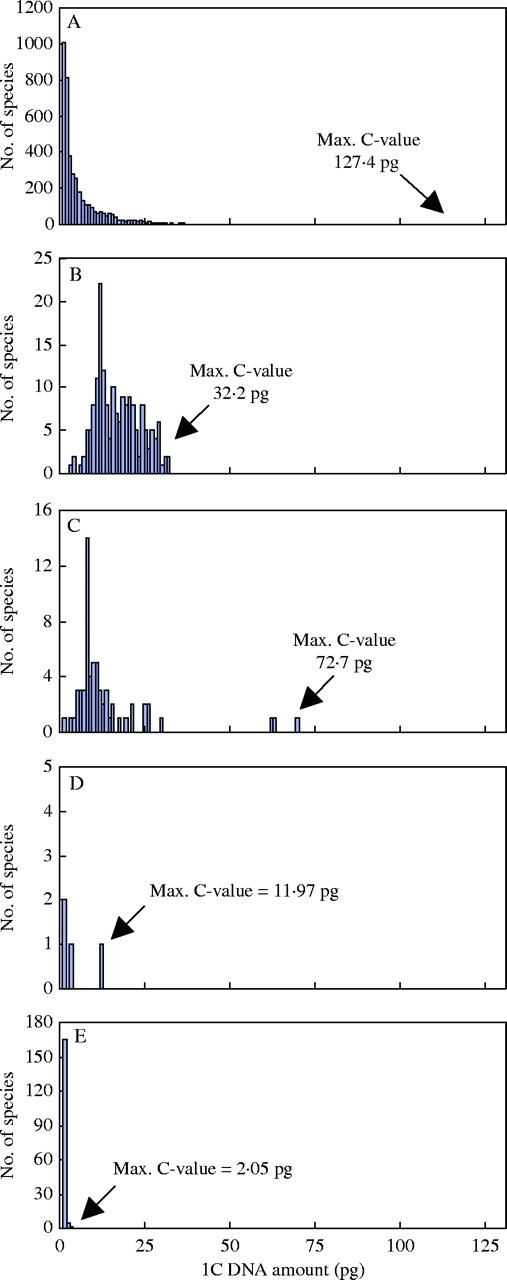
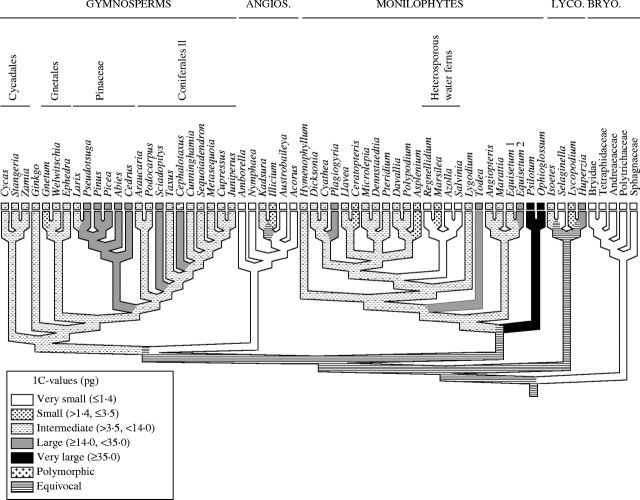
Background and aims: DNA C-values in land plants (comprising bryophytes, lycophytes, monilophytes, gymnosperms and angiosperms) vary approximately 1000-fold from approx. 0.11 to 127.4 pg. To understand the evolutionary significance of this huge variation it is essential to evaluate the phylogenetic component. Recent increases in C-value data (e.g. Plant DNA C-values database; release 2.0, January 2003; http://www.rbgkew.org.uk/cval/homepage.html) together with improved consensus of relationships between and within land plant groups makes such an analysis timely.
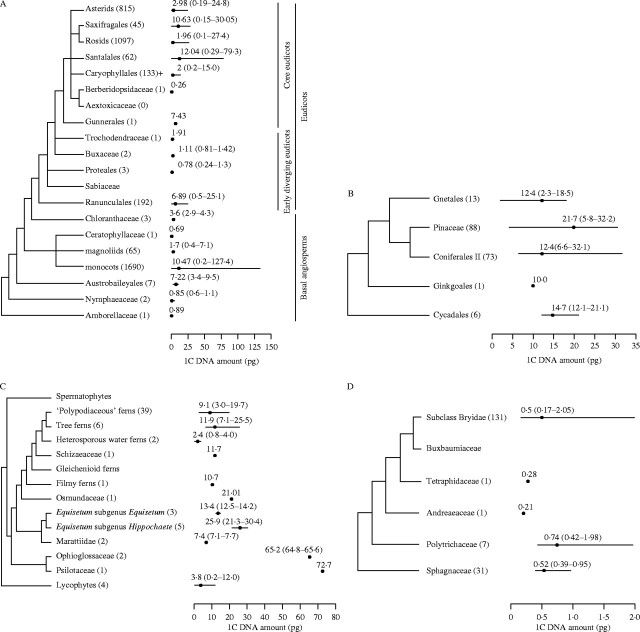
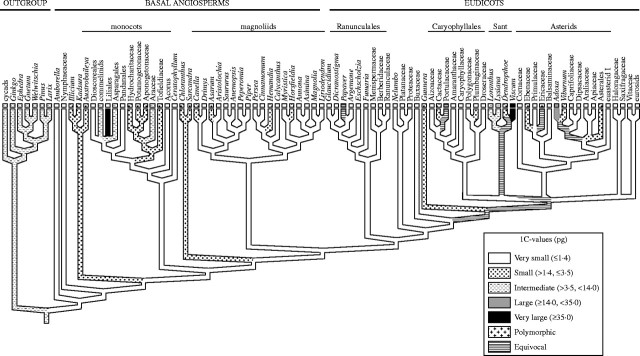
Methods: Insights into the distribution of C-values in each group of land plants were gained by superimposing available C-value data (4119 angiosperms, 181 gymnosperms, 63 monilophytes, 4 lycophytes and 171 bryophytes) onto phylogenetic trees. To enable ancestral C-values to be reconstructed for clades within land plants, character-state mapping with parsimony and MacClade was also applied.
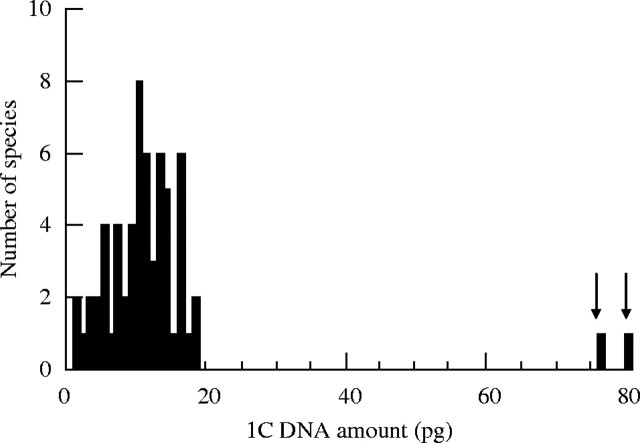
Key results and conclusions: Different land plant groups are characterized by different C-value profiles, distribution of C-values and ancestral C-values. For example, the large ( approximately 1000-fold) range yet strongly skewed distribution of C-values in angiosperms contrasts with the very narrow 12-fold range in bryophytes. Further, character-state mapping showed that the ancestral genome sizes of both angiosperms and bryophytes were reconstructed as very small (i.e. < or =1.4 pg) whereas gymnosperms and most branches of monilophytes were reconstructed with intermediate C-values (i.e. >3.5, <14.0 pg). More in-depth analyses provided evidence for several independent increases and decreases in C-values; for example, decreases in Gnetaceae (Gymnosperms) and heterosperous water ferns (monilophytes); increases in Santalales and some monocots (both angiosperms), Pinaceae, Sciadopityaceae and Cephalotaxaceae (Gymnosperms) and possibly in the Psilotaceae + Ophioglossaceae clade (monilophytes). Thus, in agreement with several focused studies within angiosperm families and genera showing that C-values may both increase and decrease, it is apparent that this dynamic pattern of genome size evolution is repeated on a broad scale across land plants.
Figures


Similar articles
-
Plastid phylogenomic analysis of green plants: A billion years of evolutionary history.Am J Bot. 2018 Mar;105(3):291-301. doi: 10.1002/ajb2.1048. Epub 2018 Mar 30. Am J Bot. 2018. PMID: 29603143
-
New reports of nuclear DNA content for 407 vascular plant taxa from the United States.Ann Bot. 2012 Dec;110(8):1623-9. doi: 10.1093/aob/mcs222. Epub 2012 Oct 24. Ann Bot. 2012. PMID: 23100602 Free PMC article.
-
Diversification of land plants: insights from a family-level phylogenetic analysis.BMC Evol Biol. 2011 Nov 21;11:341. doi: 10.1186/1471-2148-11-341. BMC Evol Biol. 2011. PMID: 22103931 Free PMC article.
-
Nuclear DNA amounts in angiosperms: targets, trends and tomorrow.Ann Bot. 2011 Mar;107(3):467-590. doi: 10.1093/aob/mcq258. Epub 2011 Jan 21. Ann Bot. 2011. PMID: 21257716 Free PMC article. Review.
-
Nuclear DNA amounts in angiosperms: progress, problems and prospects.Ann Bot. 2005 Jan;95(1):45-90. doi: 10.1093/aob/mci003. Ann Bot. 2005. PMID: 15596457 Free PMC article. Review.
Cited by
-
First nuclear DNA amounts in more than 300 angiosperms.Ann Bot. 2005 Aug;96(2):229-44. doi: 10.1093/aob/mci170. Epub 2005 May 19. Ann Bot. 2005. PMID: 15905300 Free PMC article.
-
New chromosome counts and genome size estimates for 28 species of Taraxacum sect. Taraxacum.Comp Cytogenet. 2018 Sep 18;12(3):403-420. doi: 10.3897/CompCytogen.v12i3.27307. eCollection 2018. Comp Cytogenet. 2018. PMID: 30275930 Free PMC article.
-
The effects of nuclear DNA content (C-value) on the quality and utility of AFLP fingerprints.Ann Bot. 2005 Jan;95(1):237-46. doi: 10.1093/aob/mci017. Ann Bot. 2005. PMID: 15596471 Free PMC article.
-
Genome Size and Labellum Epidermal Cell Size Are Evolutionarily Correlated With Floral Longevity in Paphiopedilum Species.Front Plant Sci. 2021 Dec 16;12:793516. doi: 10.3389/fpls.2021.793516. eCollection 2021. Front Plant Sci. 2021. PMID: 34975981 Free PMC article.
-
Genome-wide comparative analysis of the Brassica rapa gene space reveals genome shrinkage and differential loss of duplicated genes after whole genome triplication.Genome Biol. 2009;10(10):R111. doi: 10.1186/gb-2009-10-10-r111. Epub 2009 Oct 12. Genome Biol. 2009. PMID: 19821981 Free PMC article.
References
-
- Abraham A, Ninan CA, Mathew PM. 1962. Studies on the cytology and phylogeny of the pteridophytes VII. Observations on one hundred species of South Indian ferns. Journal of the Indian Botanical Society 41: 339–421.
-
- APG II. 2003. An update of the Angiosperm Phylogeny Group classification for the orders and families of flowering plants. Botanical Journal of the Linnean Society 141: 399–436.
-
- Beckert S, Steinhauser S, Muhle H, Knoop V. 1999. A molecular phylogeny of bryophytes based on nucleotide sequences of the mitochondrial nad5 gene. Plant Systematics and Evolution 218: 179–192.
-
- Bennett MD. 1972. Nuclear DNA content and minimum generation time in herbaceous plants. Proceedings of the Royal Society of London Series B, Biological Sciences 181: 109–135. - PubMed
-
- Bennett MD. 1987. Variation in genomic form in plants and its ecological implications. New Phytologist 106: 177–200.
