. 2005 Feb;88(2):1143-55.
doi: 10.1529/biophysj.104.050310. Epub 2004 Dec 13.

Electro-deformation and poration of giant vesicles viewed with high temporal resolution

Affiliations

Electro-deformation and poration of giant vesicles viewed with high temporal resolution

Karin A Riske et al. Biophys J. 2005 Feb.

Abstract

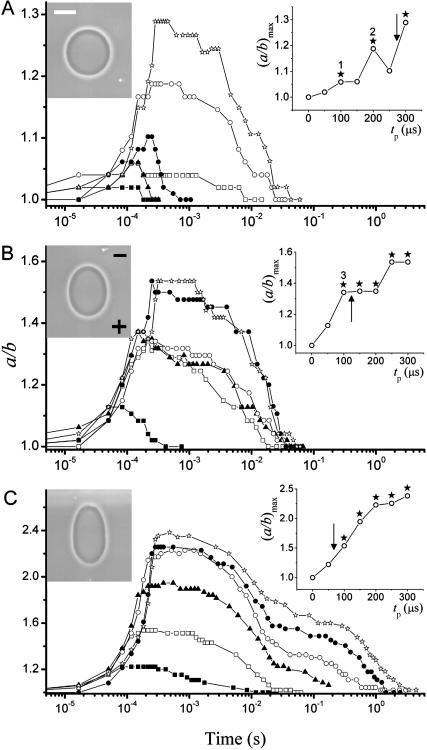
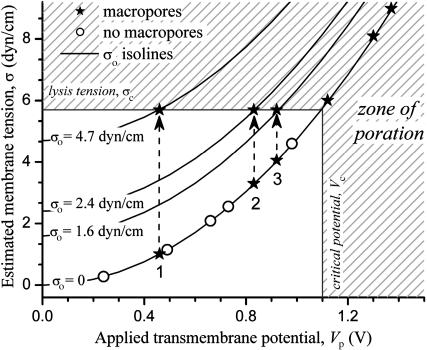
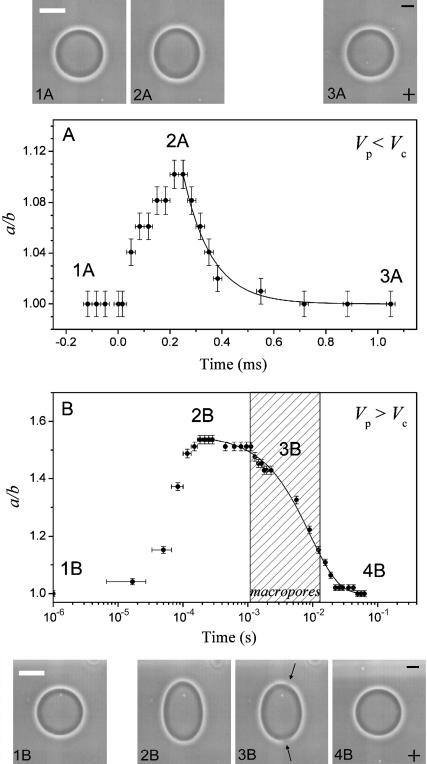
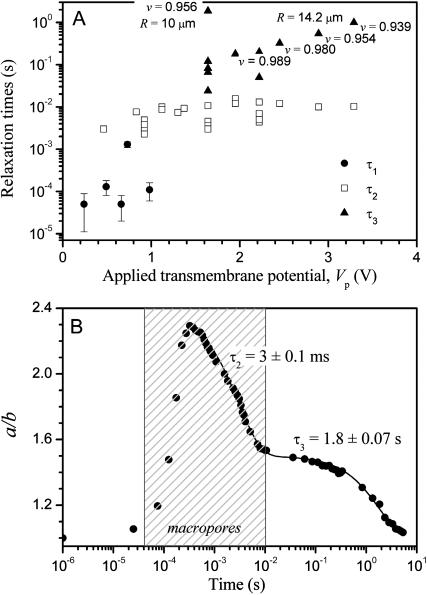
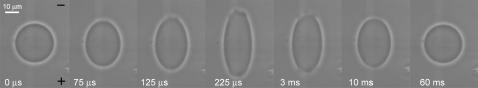
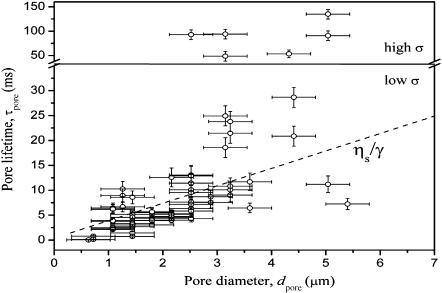
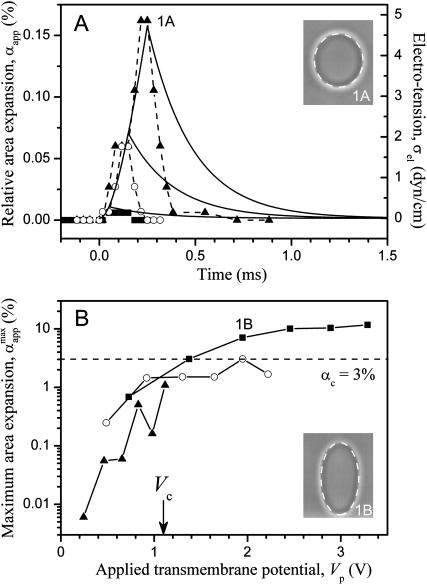
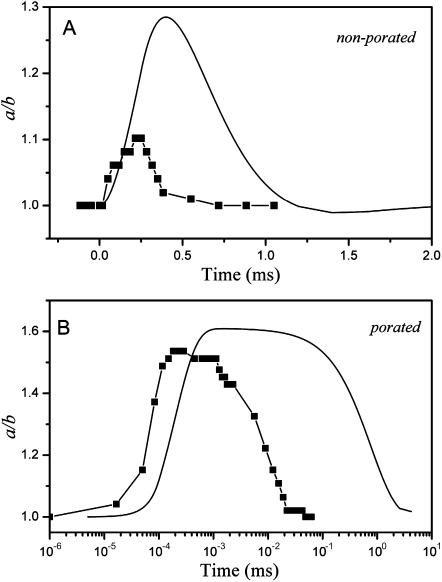
Fast digital imaging was used to study the deformation and poration of giant unilamellar vesicles subjected to electric pulses. For the first time the dynamics of response and relaxation of the membrane at micron-scale level is revealed at a time resolution of 30 micros. Above a critical transmembrane potential the lipid bilayer ruptures. Formation of macropores (diameter approximately 2 microm) with pore lifetime of approximately 10 ms has been detected. The pore lifetime has been interpreted as interplay between the pore edge tension and the membrane viscosity. The reported data, covering six decades of time, show the following regimes in the relaxation dynamics of the membrane. Tensed vesicles first relax to release the acquired stress due to stretching, approximately 100 micros. In the case of poration, membrane resealing occurs with a characteristic time of approximately 10 ms. Finally, for vesicles with excess area an additional slow regime was observed, approximately 1 s, which we associate with relaxation of membrane curvature. Dimensional analysis can reasonably well explain the corresponding characteristic timescales. Being performed on cell-sized giant unilamellar vesicles, this study brings insight to cell electroporation. The latter is widely used for gene transfection and drug transport across the membrane where processes occurring at different timescales may influence the efficiency.


Figures

FIGURE 1
FIGURE 1
Degree of deformation (a/b) induced on one vesicle when applying different square-wave pulses: (A) 1 kV/cm, (B) 2 kV/cm, and (C) 3 kV/cm. For each pulse strength, the applied pulses were of duration tp = 50 μs (▪), 100 μs (□), 150 μs (▴), 200 μs (○), 250 μs (•), and 300 μs (⋆). The image acquisition rate was 30,000 fps. Time t = 0 was set as the beginning of the pulse. The insets show the maximum value of the deformation (a/b)max as a function of pulse duration, tp, for each pulse strength. Arrows indicate the tense-free poration limit (Vp > Vc). The time interval between applying consecutive pulses was generally 5 min. The images on each graph correspond to the maximal elongation for the pulse of duration tp = 150 μs. The scale bar indicates 15 μm. The electrode's polarity is indicated with a plus and a minus sign on the second snapshot.
FIGURE 2
FIGURE 2
Total membrane tension σ, as a function of the transmembrane potential at the end of the pulse, Vp (σ is given by σ = σel + σo, where the electrotension σel was calculated from Eq. 3 and σo is some initial tension). Cases where no macroporation was observed are displayed as open circles (○), whereas those where macropores were visualized are indicated with stars (★). The shaded area indicates zone of expected poration where Vp is above the tense-free critical potential, Vc = 1.1 V, and/or the membrane tension is above the critical rupture tension σc = 5.7 dyn/cm. On three occasions (marked with numbers according to the sequence of the applied pulses) the vesicle macroporated below the poration limit (Vp < Vc), presumably because of some initial membrane tension, σo. Isolines at different σo present possible trajectories or states of the vesicle for the three cases where macroporation was observed at Vp < Vc.
FIGURE 3
FIGURE 3
Degree of deformation (a/b) attained by one vesicle when subjected to two different square-wave pulses: (A) E = 1 kV/cm, tp = 250 μs (Vp < Vc); and (B) E = 3 kV/cm, tp = 100 μs (Vp > Vc). Time t = 0 was set as the beginning of the pulse. The image acquisition rate was 30,000 fps. Snapshots corresponding to the time frames indicated with numbers on the graphs are shown above and below the graphs. The scale bar on the first snapshots in the series corresponds to 15 μm. The electrode's polarity is indicated with a plus and a minus sign on the last snapshots. The shaded area in panel B shows the time interval when macropores were detected (indicated with arrows on snapshot 3B). Note that the time in panel B is given in logarithmic scale. Solid lines indicate exponential fit with decay times (A) τ1 and (B) τ2 (see text for details).
FIGURE 4
FIGURE 4
(A) Decay times obtained from exponential fits to the relaxation of a/b with time as a function of the apparent transmembrane potential Vp at the end of each pulse. The relaxation times are divided in three categories: without macropores, τ1 (•), and with macropores, τ2 (□) and τ3 (▴). As discussed in the text, τ3 is associated with membrane fluctuations and depends on the reduced volume of the vesicles, v, (for clarity, the values of v are indicated on the figure only in some of the cases). (B) Response and relaxation of a macroporated vesicle (E = 2 kV/cm, tp = 200 μs, t = 0 was set as the beginning of the pulse) and corresponding exponential fits with decay times τ2 and τ3 as described in the text. The image acquisition rate was 50,000 fps. The shaded area indicates the time interval when macropores are detected. The radius of this vesicle is 10.8 μm.
FIGURE 5
FIGURE 5
A snapshot sequence of a vesicle subjected to a pulse, E = 2 kV/cm, tp = 200 μs. The image acquisition rate was 50,000 fps. Macropores are first visualized in the third frame (t = 125 μs). The electrode's polarity is indicated with a plus (+) and a minus (−) sign on the first snapshot.
FIGURE 6
FIGURE 6
Macropore lifetime (τpore) as a function of pore diameter (dpore) measured on 15 different vesicles. The dashed line has a slope ηs/γ (see text for details). The horizontal line delimits a region of pores with longer lifetime. Presumably they have been stabilized by high residual membrane tension, σ, after applying the pulse (note the difference in the axes).
FIGURE 7
FIGURE 7
(A) Apparent relative area change (αapp) calculated from Eq. 5 as a function of time for consecutive pulses: E = 1 kV/cm, tp = 50 (▪), 150 (○), and 250 (▴) μs. Time t = 0 was set as the beginning of the pulse. The solid lines (right axis) show the electrical tension σel induced on the membrane calculated for the same three pulses; see Eq. 6. (B) Maximum relative area increase, formula image for all pulses from the sequence shown in Fig. 1. The data for each pulse strength (E = 1 kV/cm, ▴; 2 kV/cm, ○; and 3 kV/cm, ▪) are shown as a function of the applied transmembrane potential at the end of the pulse Vp. The dashed line indicates αc = 3%. Note that αapp can be different from the real relative area increase α (see text for details). The two snapshots show the vesicle at maximum deformation for the pulses E = 1 kV/cm, tp = 250 μs (1A) and E = 3 kV/cm, tp = 150 μs (1B). The dashed lines are ellipses constructed with the same (a/b)max as experimentally measured.
FIGURE 8
FIGURE 8
Experimental data (▪; same as in Fig. 3) and theoretical predictions (solid curves; according to Hyuga et al., 1991a,b) for the response and relaxation dynamics of a vesicle subjected to pulses below (A) and above (B) the poration limit. (A) E = 1 kV/cm, tp = 250 μs (Vp < Vc) and (B) E = 3 kV/cm, tp = 100 μs (Vp > Vc). The theoretical curves, according to (A) Hyuga et al. (1991b) and (B) Hyuga et al. (1991a), have been calculated for the same pulse strength and duration, vesicle radius (R = 15 μm) as in the experiments, resistance factor γres = 15 g cm−2 s−1 and mass factor νmass = 10. For the porated case (B), a conductivity ratio λin/λout = 1.3 was used (see text for details).

References

    1. Abidor, I. G., V. B. Arakelyan, L. V. Chernomordik, Y. A. Chizmadzhev, V. F. Pastushenko, and M. R. Tarasevich. 1979. Electric breakdown of bilayer lipid membranes. I. The main experimental facts and their qualitative discussion. J. Electroanal. Chem. 104:37–52.
    1. Angelova, M. I., and D. S. Dimitrov. 1986. Liposome electroformation. Faraday Discuss. Chem. Soc. 81:303–311.
    1. Aranda-Espinoza, H., H. Bermudez, F. S. Bates, and D. E. Discher. 2001. Electromechanical limits of polymersomes. Phys. Rev. Lett. 20:208301. - PubMed
    1. Bermúdez, H., H. Aranda-Espinoza, D. A. Hammer, and D. E. Discher. 2003. Pore stability and dynamics in polymer membranes. Europhys. Lett. 64:550–556.
    1. Brochard-Wyart, F., P. G. de Gennes, and O. Sandre. 2000. Transient pores in stretched vesicles: role of leak-out. Physica A. 278:32–51.

LinkOut - more resources