. 2005 Feb;88(2):1467-78.
doi: 10.1529/biophysj.104.049619. Epub 2004 Dec 13.

A two-photon FRAP analysis of the cytoskeleton dynamics in the microvilli of intestinal cells

Affiliations

A two-photon FRAP analysis of the cytoskeleton dynamics in the microvilli of intestinal cells

François Waharte et al. Biophys J. 2005 Feb.

Abstract

The molecular structure of the brush-border of enterocytes has been investigated since the 1980s, but the dynamics of this highly specialized subcellular domain have been difficult to study due to its small size. To perform a detailed analysis of the dynamics of cytoskeleton proteins in this domain, we developed two-photon fluorescence recovery after photobleaching and a theoretical framework for data analysis. With this method, fast dynamics of proteins in the microvilli of the brush border of epithelial intestinal cells can be measured on the millisecond timescale in volumes smaller than 1 microm3. Two major proteins of the cytoskeleton of the microvilli, actin and myosin 1a (Myo1a; formerly named brush border myosin I), are mobile in the brush-border of Caco-2 cells, an enterocyte-like cellular model. However, the mobility of actin is very different from that of Myo1a and they appear to be unrelated (diffusion coefficient of 15 microm2 s(-1) with a mobile fraction of 60% for actin, and 4 microm2 s(-1) with a mobile fraction of 90% for Myo1a). Furthermore, we show for the first time, in vivo, that the dynamics of Myo1a in microvilli reflect its motor activity.


Figures
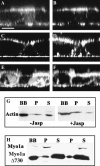
FIGURE 1
FIGURE 1
Cellular distribution of EGFP-fusion proteins in Caco-2 cells. (AF) The distribution of EGFP-actin (A), EGFP-Myo1a (C), and EGFP-Myo1aΔ730 (E) in fully differentiated Caco-2 clones was compared to the distribution of filamentous actin (B, D, and F) decorated with rhodamine phalloidin conjugate in x,z optical confocal sections. (Scale bar represents 13 μm.) (GH) Isolated brush-border from cells expressing EGFP-actin (G), EGFP-Myo1a, and EGFP-Myo1aΔ730 (H) were analyzed after extraction with 1% Triton X-100 and centrifugation (30 min at 300,000 g). Twenty micrograms of each fraction were then probed after Western blot with anti-GFP antibody. G shows that EGFP-actin from total brush-border fractions (BB) is detected in both the Triton insoluble (P) and soluble fractions (S) and shifts to the Triton insoluble fraction (P) after treatment with 1 μM jasplakinolide. H shows that 10 mM ATP releases EGFP-Myo1a from the Triton insoluble fraction, whereas EGFP-Myo1aΔ730 (tail domain) is mainly Triton soluble regardless of the ATP concentration.
FIGURE 2
FIGURE 2
Geometry used for numerical simulations of two-photon FRAP experiments. On the left is a representation of a microvillus and the PSF (not to scale); on the right is the one-dimensional axis used for numerical computations with reflective boundary conditions. The PSF (I2(x)) is projected on the axis and placed at 1 μm from one end of the axis for experimental data fitting. Axis length (L) was taken as 80 μm.
FIGURE 3
FIGURE 3
Comparison of the timescales involved in FRAP experiments. In an experiment with a bleaching pulse of duration, τp, followed by a relaxation observation time, τobs, the physically relevant timescales are: τd the characteristic time of diffusive relaxation in the excitation volume, and the characteristic times τb-bl and τbl-obs of the photobleaching process caused by the high power of the bleaching pulse (Ppulse) and by the moderate power (Pobs) used for observing the relaxation, respectively. In the ideal situation (line a), the working hypotheses, often implicitly made but most often not realized in FRAP experiments, are that (H1) no diffusion occurs during the bleaching pulse (Tp < τd) and (H2) the bleaching is negligible during the time taken to assess the relaxation (Tobs < τb-obs). In the situation of the present work (line b), which is likely to be relevant in most FRAP experiments on cells, bleaching and relaxation cannot be temporally separated: diffusion is not negligible during the bleaching pulse (τd < Tp), and bleaching occurs during the time devoted to assess the relaxation (τb-obs < Tobs).
FIGURE 4
FIGURE 4
Photobleaching kinetics and characteristic times for immobilized EGFP. Normalized EGFP fluorescence decay upon photobleaching was measured at a pulse power Ppulse = 30 mW (♦) and observation power Pobs = 5 mW (○ and •) on immobilized EGFP-fused proteins: actin (•,♦) and Myo1a (○) in glutaraldehyde-fixed cells. Fluorescence decay at Pobs is fitted with a single exponential function with or without an offset (offset value = 0.3). Decay at Ppulse was also fit to an exponential (in the inset), with the same offset. The insert shows the same curves on a logarithmic timescale to reveal the fast kinetics of photobleaching, and illustrates the departure from exponential behaviors. Best exponential fits are shown with an offset (continuous lines).
FIGURE 5
FIGURE 5
Experimental observation of spatial concentration depletion. Effect of the photobleaching pulse duration (τp) on the normalized fluorescence recovery of freely diffusing EGFP in aqueous solution. Increasing τp simply shifts the relaxation to longer timescales: τp = 2 ms (•), τp = 35 ms (○), and τp = 135 ms (♦). Fluorescence relaxation essentially depends on the relative time t/τp as shown by the superimposition on a single master curve of the relaxation kinetics after time normalization (inset).
FIGURE 6
FIGURE 6
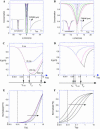
Numerical simulations of fluorescence depletion. Concentration axial profiles of unbleached molecules during the photobleaching pulse are represented at different times (between 0 and 400 ms) for two extreme cases, a low mobility protein with D = 0.2 μm2 s−1 (A), and a high mobility protein with D = 80 μm2 s−1 (B). The dotted line represents the PSF. (Left inserts) The profiles were normalized so that their full width at half-maximum is the same, showing the evolution of the shape of the profile independently of their amplitude. (Right inserts) Evolution of the full width at half-maximum as a function of photobleaching pulse duration. Calculated fluorescence evolution during the photobleaching pulse and the recovery phase are represented for different photobleaching pulse durations (Tp = 2, 35, 200, and 500 ms; arrows indicate increasing photobleaching times), for D = 0.2 μm2 s−1 (with Tp < τd) (C) and D = 80 μm2 s−1 (with τd < Tp). (D) The values of characteristic diffusion times τd (τd = 5 s for the low mobility protein and 0.012 s for the high mobility protein assuming a 1 μm2 surface), of the characteristic photobleaching time τb-bl (= 0.026 s from Fig. 3), and of the photobleaching time used in our experiments shown in Figs. 7–10 (Td = 0.2 s), are indicated on the time axis for comparison with the cases shown in Fig. 2. The recovery curves for different photobleaching pulse durations (C, D), with normalized amplitudes are shown in E: D = 0.2 μm2 s−1 and F: D = 80 μm2 s−1. The vertical bar corresponds to the starting point of our experimental measurements on microvilli (see Figs. 7–10).
FIGURE 7
FIGURE 7
Numerical simulations of diffusion processes with observation photobleaching. (A) Numerical simulations of the recovery curve after a photobleaching pulse (bottom) and of the baseline curve without pulse bleaching (top) are represented for different values D = 1, 5, 20, and 80 μm2 s−1, and mobile fractions of 100%. (B) Numerical simulations of the recovery (bottom) and baseline (top) curves are represented for two different mobile fractions and diffusion coefficients (D = 20 μm2 s−1, mobile fraction = 50% and D = 2 μm2 s−1, mobile fraction = 80%, dashed and continuous lines, respectively). Note that the two curves intersect under these conditions.
FIGURE 8
FIGURE 8
Mobility of EGFP-Myo1a and EGFP-actin in the brush-border of Caco-2 cells. (A) The recovery curves with (bottom) or without (baseline, top) a photobleaching pulse are shown for EGFP-Myo1a (○) and EGFP-actin (•). (B) The difference of these two curves (baseline minus recovery) is shown for EGFP-Myo1a (○). Data fit with simulated curves are shown (continuous lines), with D = 4 μm2 s−1 (best fit), D = 3 μm2 s−1 (curve above the data) and D = 5 μm2 s−1 (curve under the data) and a mobile fraction of 90% (mean ± SD of 273 curves for EGFP-Myo1a and 201 curves for EGFP-actin). (C) Same experimental curve as in B but with different values of the mobile fraction for the simulated curves: 90% for the best fit, 80% for the curve above the data, and 100% for the curve under the experimental data. (D) Data are shown for both EGFP-Myo1a (○) and EGFP-actin (•) with simulated curves (only best-fit curves are shown here). The EGFP-actin curve was fit with D = 15 μm2 s−1 and a mobile fraction of 60%.
FIGURE 9
FIGURE 9
Effect of jasplakinolide treatment on EGFP-actin mobility. The difference between the baseline curve and recovery curve is represented for EGFP-actin before (○) and after (•) jasplakinolide treatment, and for immobile actin in fixed cells (▵). (Mean of 69 curves cells expressing EGFP-actin treated with jasplakinolide.)
FIGURE 10
FIGURE 10
Effect of ATP depletion on the mobility of EGFP-actin, EGFP-Myo1a, and EGFP-Myo1aΔ730. Recovery curves were acquired before and after ATP depletion, and the ratio (recovery curve after ATP depletion)/(recovery curve before) is represented for EGFP-Myo1a (•), EGFP-actin (○), and EGFP-Myo1aΔ730 (▵). (Mean of 407, 140, and 149 curves, respectively.)
FIGURE 11
FIGURE 11
Influence of the motor activity of EGFP-Myo1a on its mobility. The difference between the baseline curve and recovery curve is represented for EGFP-Myo1a (○), EGFP-Myo1a after BDM treatment (•), and EGFP-Myo1aΔ730 (▵). (A) Fits for EGFP-Myo1a (•) with D = 4 μm2 s−1, and mobile fraction 90%, and for EGFP-Myo1aΔ730 (○) with D = 2.8 μm2 s−1 and a mobile fraction 84% are shown in B (mean ± SD of 207 curves for cells expressing EGFP-Myo1aΔ730, and 112 for cells expressing EGFP-Myo1a before and after BDM treatment).

Similar articles

Cited by

References

    1. Axelrod, D., D. E. Koppel, J. Schlessinger, E. Elson, and W. W. Webb. 1976. Mobility measurement by analysis of fluorescence photobleaching recovery kinetics. Biophys. J. 16:1055–1069. - PMC - PubMed
    1. Bacallao, R., A. Garfinkel, S. Monke, G. Zampighi, and L. J. Mandel. 1994. ATP depletion: a novel method to study junctional properties in epithelial tissues. I. Rearrangement of the actin cytoskeleton. J. Cell Sci. 107:3301–3313. - PubMed
    1. Ballestrem, C., B. Wehrle-Haller, and B. A. Imhof. 1998. Actin dynamics in living mammalian cells. J. Cell Sci. 111:1649–1658. - PubMed
    1. Bartles, J., L. Zheng, A. Li, A. Wierda, and B. Chen. 1998. Small espin: a third actin-bundling protein and potential forked protein ortholog in brush border microvilli. J. Cell Biol. 143:107–119. - PMC - PubMed
    1. Braeckmans, K., L. Peeters, N. N. Sanders, S. C. De Smedt, and J. Demeester. 2003. Three-dimensional fluorescence recovery after photobleaching with the confocal scanning laser microscope. Biophys. J. 85:2240–2252. - PMC - PubMed

Publication types

MeSH terms

LinkOut - more resources