

Collective movement of epithelial cells on a collagen gel substrate
- PMID: 15596493
- PMCID: PMC1305274
- DOI: 10.1529/biophysj.104.047654
Collective movement of epithelial cells on a collagen gel substrate
Abstract
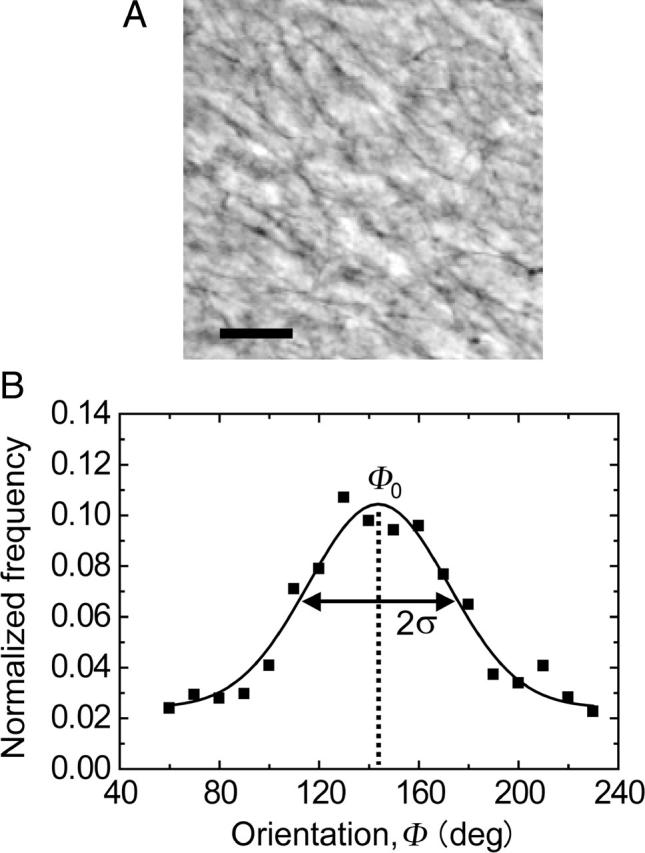
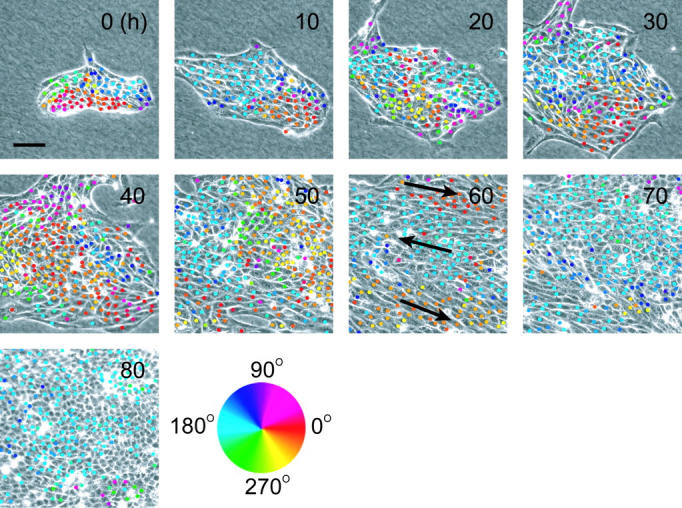
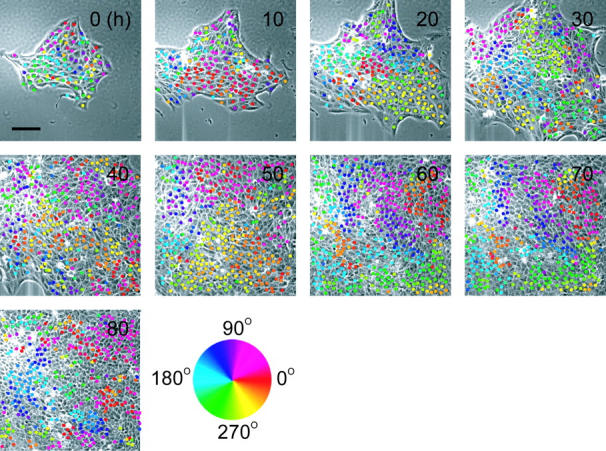
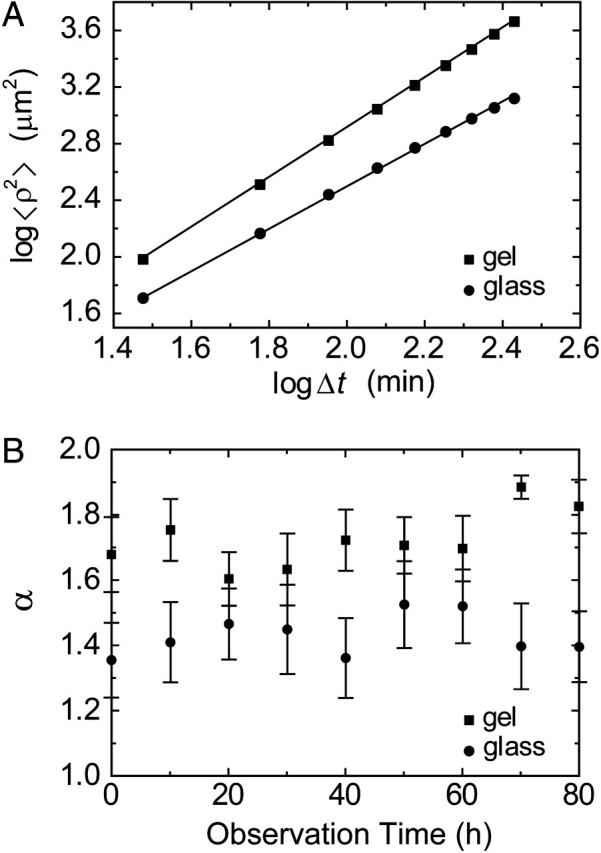
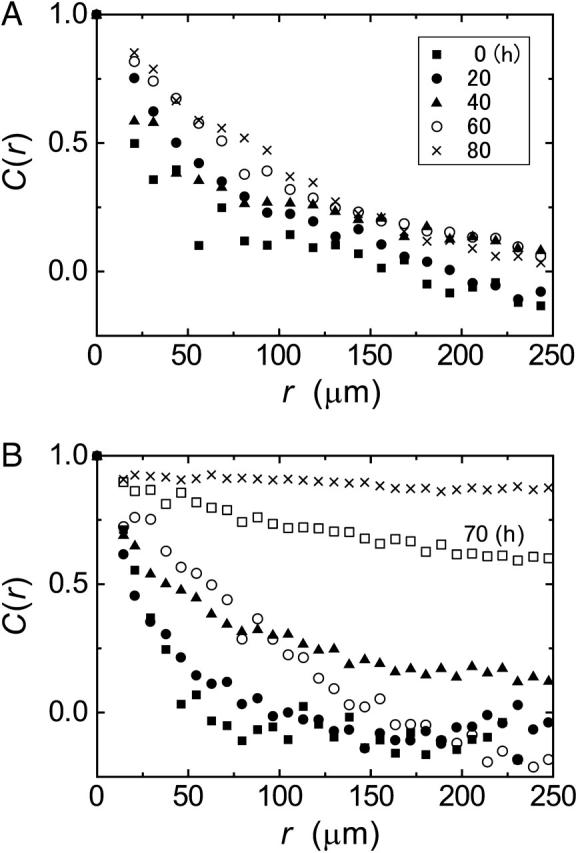
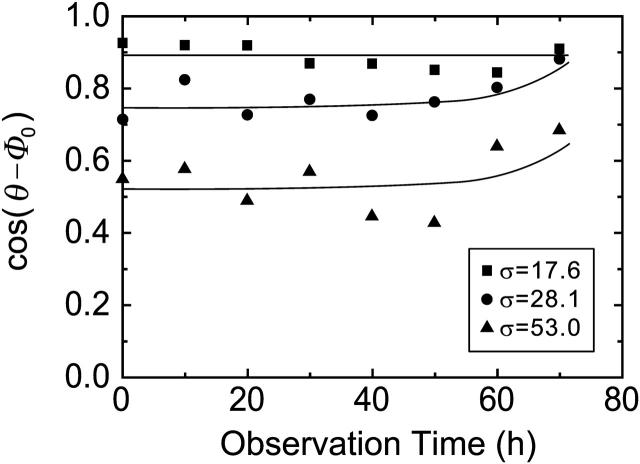
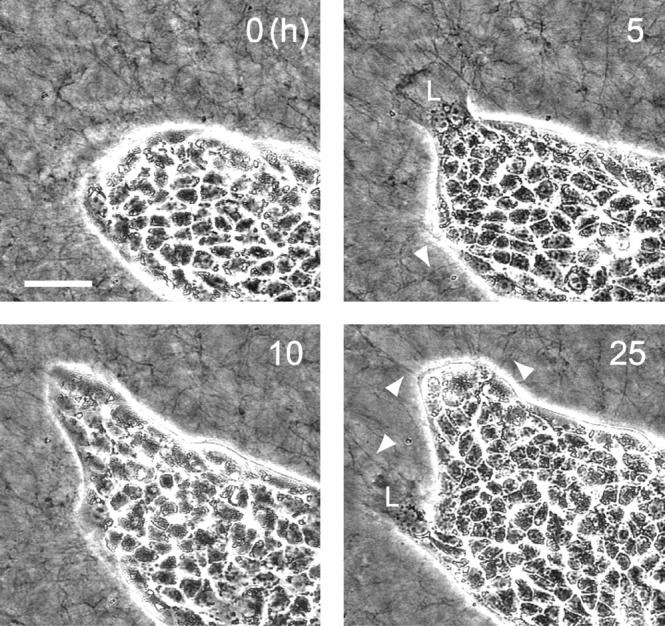
Collective cell movement acts as an efficient strategy in many physiological events, including wound healing, embryonic development, and morphogenesis. We found that epithelial cells (Madin-Darby canine kidney cell) migrated collectively along one direction on a collagen gel substrate. Time-lapse images of Madin-Darby canine kidney cells cultured on type-I collagen gels and glass substrates were captured by phase contrast microscopy equipped with an incubation system. On the gel substrate, the directions of cell movement gradually converged on one direction as the number of cells increased, whereas the cells moved randomly on the glass substrate. We also observed "leader" cells, which extended large lamellae and were accompanied by many "follower" cells, migrating in the direction of oriented collagen fibers. The mean-squared displacement of each cell movement and the spatial correlation function calculated from the spatial distribution of cell velocity were obtained as functions of observation time. In the case of the gel substrate, the spatial correlation length increased gradually, representing the collectiveness of multicellular movement.
Figures
Similar articles
-
Hepatocyte growth factor and Madin-Darby canine kidney cells: in vitro models of epithelial cell movement and morphogenesis.Microsc Res Tech. 1998 Dec 1;43(5):456-63. doi: 10.1002/(SICI)1097-0029(19981201)43:5<456::AID-JEMT11>3.0.CO;2-2. Microsc Res Tech. 1998. PMID: 9858342
-
Constitutively active mitogen-activated protein kinase kinase MEK1 disrupts morphogenesis and induces an invasive phenotype in Madin-Darby canine kidney epithelial cells.Cell Growth Differ. 1999 May;10(5):317-32. Cell Growth Differ. 1999. PMID: 10359013
-
Morphogenesis of MDCK cells in a collagen gel matrix culture under stromal adipocyte-epithelial cell interaction.Kidney Int. 2001 Aug;60(2):568-78. doi: 10.1046/j.1523-1755.2001.060002568.x. Kidney Int. 2001. PMID: 11473639
-
Mechanobiology of leader-follower dynamics in epithelial cell migration.Curr Opin Cell Biol. 2020 Oct;66:97-103. doi: 10.1016/j.ceb.2020.05.007. Epub 2020 Jul 11. Curr Opin Cell Biol. 2020. PMID: 32663734 Review.
-
Collective cell migration of epithelial and mesenchymal cells.Cell Mol Life Sci. 2013 Oct;70(19):3481-92. doi: 10.1007/s00018-012-1251-7. Epub 2013 Jan 12. Cell Mol Life Sci. 2013. PMID: 23314710 Free PMC article. Review.
Cited by
-
Computational model of cell positioning: directed and collective migration in the intestinal crypt epithelium.J R Soc Interface. 2010 Jun 6;7 Suppl 3(Suppl 3):S351-63. doi: 10.1098/rsif.2010.0018.focus. Epub 2010 Mar 31. J R Soc Interface. 2010. PMID: 20356873 Free PMC article.
-
Cancer cell metabolic plasticity in migration and metastasis.Clin Exp Metastasis. 2021 Aug;38(4):343-359. doi: 10.1007/s10585-021-10102-1. Epub 2021 Jun 2. Clin Exp Metastasis. 2021. PMID: 34076787 Review.
-
Collective cell migration: leadership, invasion and segregation.J R Soc Interface. 2012 Dec 7;9(77):3268-78. doi: 10.1098/rsif.2012.0448. Epub 2012 Jul 25. J R Soc Interface. 2012. PMID: 22832363 Free PMC article.
-
Stiffness-Modulation of Collagen Gels by Genipin-Crosslinking for Cell Culture.Gels. 2023 Feb 10;9(2):148. doi: 10.3390/gels9020148. Gels. 2023. PMID: 36826318 Free PMC article.
-
Collective cell streams in epithelial monolayers depend on cell adhesion.New J Phys. 2013 Jul;15:10.1088/1367-2630/15/7/075006. doi: 10.1088/1367-2630/15/7/075006. New J Phys. 2013. PMID: 24363603 Free PMC article.
References
-
- Armstrong, P. B. 1985. The control of cell motility during embryogenesis. Cancer Metast. Rev. 4:59–79. - PubMed
-
- Beloussov, L. V., N. N. Louchinskaia, and A. A. Stein. 2000. Tension-dependent collective cell movements in the early gastrula ectoderm of Xenopus laevis embryos. Dev. Genes Evol. 210:92–104. - PubMed
-
- Chung, C. Y., and R. A. Firtel. 2002. Signaling pathways at the leading edge of chemotaxing cells. J. Muscle Res. Cell Motil. 23:773–779. - PubMed
-
- Dickinson, R. B., and R. T. Tranquillo. 1993. Optimal estimation of cell movement indices from the statistical analysis of cell tracking data. Am. Inst. Chem. Eng. J. 39:1995–2010.
Publication types
MeSH terms
Substances
LinkOut - more resources
Full Text Sources
Other Literature Sources
Research Materials
