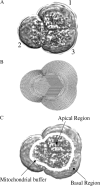
Calcium oscillations in a triplet of pancreatic acinar cells
- PMID: 15596494
- PMCID: PMC1305211
- DOI: 10.1529/biophysj.104.047357
Calcium oscillations in a triplet of pancreatic acinar cells
Abstract
We use a mathematical model of calcium dynamics in pancreatic acinar cells to investigate calcium oscillations in a ring of three coupled cells. A connected group of cells is modeled in two different ways: 1), as coupled point oscillators, each oscillator being described by a spatially homogeneous model; and 2), as spatially distributed cells coupled along their common boundaries by gap-junctional diffusion of inositol trisphosphate and/or calcium. We show that, although the point-oscillator model gives a reasonably accurate general picture, the behavior of the spatially distributed cells cannot always be predicted from the simpler analysis; spatially distributed diffusion and cell geometry both play important roles in determining behavior. In particular, oscillations in which two cells are in synchrony, with the third phase-locked but not synchronous, appears to be more dominant in the spatially distributed model than in the point-oscillator model. In both types of model, intercellular coupling leads to a variety of synchronous, phase-locked, or asynchronous behaviors. For some parameter values there are multiple, simultaneous stable types of oscillation. We predict 1), that intercellular calcium diffusion is necessary and sufficient to coordinate the responses in neighboring cells; 2), that the function of intercellular inositol trisphosphate diffusion is to smooth out any concentration differences between the cells, thus making it easier for the diffusion of calcium to synchronize the oscillations; 3), that groups of coupled cells will tend to respond in a clumped manner, with groups of synchronized cells, rather than with regular phase-locked periodic intercellular waves; and 4), that enzyme secretion is maximized by the presence of a pacemaker cell in each cluster which drives the other cells at a frequency greater than their intrinsic frequency.
Figures


Similar articles
-
Intercellular calcium signalling in cultured renal epithelia: a theoretical study of synchronization mode and pacemaker activity.Eur Biophys J. 2004 Dec;33(8):657-70. doi: 10.1007/s00249-004-0409-0. Epub 2004 May 26. Eur Biophys J. 2004. PMID: 15565440
-
A bifurcation analysis of two coupled calcium oscillators.Chaos. 2001 Mar;11(1):237-246. doi: 10.1063/1.1342161. Chaos. 2001. PMID: 12779457
-
Calcium waves and oscillations driven by an intercellular gradient of inositol (1,4,5)-trisphosphate.Biophys Chem. 1998 May 5;72(1-2):101-9. doi: 10.1016/s0301-4622(98)00126-4. Biophys Chem. 1998. PMID: 9652088
-
Modelling of simple and complex calcium oscillations. From single-cell responses to intercellular signalling.Eur J Biochem. 2002 Mar;269(5):1333-55. doi: 10.1046/j.0014-2956.2001.02720.x. Eur J Biochem. 2002. PMID: 11874447 Review.
-
Intercellular calcium waves mediated by inositol trisphosphate.Ciba Found Symp. 1995;188:175-89; discussion 189-94. Ciba Found Symp. 1995. PMID: 7587616 Review.
Cited by
-
Intercellular synchronization of diffusively coupled Ca(2+) oscillators.J Chem Biol. 2012 Jan;5(1):27-34. doi: 10.1007/s12154-011-0066-6. Epub 2011 Sep 9. J Chem Biol. 2012. PMID: 22962563 Free PMC article.
-
Essential role of PI3-kinase and phospholipase A2 in Dictyostelium discoideum chemotaxis.J Cell Biol. 2007 Jun 4;177(5):809-16. doi: 10.1083/jcb.200701134. Epub 2007 May 29. J Cell Biol. 2007. PMID: 17535967 Free PMC article.
-
Computational Model of Complex Calcium Dynamics: Store Operated Ca2+ Channels and Mitochondrial Associated Membranes in Pancreatic Acinar Cells.Cell Biochem Biophys. 2025 Mar;83(1):519-535. doi: 10.1007/s12013-024-01484-6. Epub 2024 Sep 13. Cell Biochem Biophys. 2025. PMID: 39266873
-
Calcium imaging in intact mouse acinar cells in acute pancreas tissue slices.PLoS One. 2022 Jun 3;17(6):e0268644. doi: 10.1371/journal.pone.0268644. eCollection 2022. PLoS One. 2022. PMID: 35657915 Free PMC article.
-
Biased random walk by stochastic fluctuations of chemoattractant-receptor interactions at the lower limit of detection.Biophys J. 2007 Sep 1;93(5):1787-96. doi: 10.1529/biophysj.107.104356. Epub 2007 May 18. Biophys J. 2007. PMID: 17513372 Free PMC article.
References
-
- Ashwin, P., G. King, and W. Swift. 1990. Three identical oscillators with symmetric coupling. Nonlinearity. 3:585–601.
-
- Baesens, C., J. Guckenheimer, S. Kim, and R. MacKay. 1991. Three coupled oscillators: mode-locking, global bifurcations and toroidal chaos. Phys. D. 49:387–475.
-
- Berridge, M., and G. Dupont. 1994. Spatial and temporal signalling by calcium. Curr. Opin. Cell Biol. Rev. 6:267–274. - PubMed
-
- Cancela, J. 2001. Specific Ca2+ signalling evoked by cholecystokinin and acetylcholine: The roles of NAADP, cADPR, and IP3. Annu. Rev. Physiol. 63:99–117. - PubMed
Publication types
MeSH terms
Substances
Grants and funding
LinkOut - more resources
Full Text Sources
Other Literature Sources
Miscellaneous

