

The effect of ergosterol on dipalmitoylphosphatidylcholine bilayers: a deuterium NMR and calorimetric study
- PMID: 15596499
- PMCID: PMC1305234
- DOI: 10.1529/biophysj.104.051375
The effect of ergosterol on dipalmitoylphosphatidylcholine bilayers: a deuterium NMR and calorimetric study
Abstract
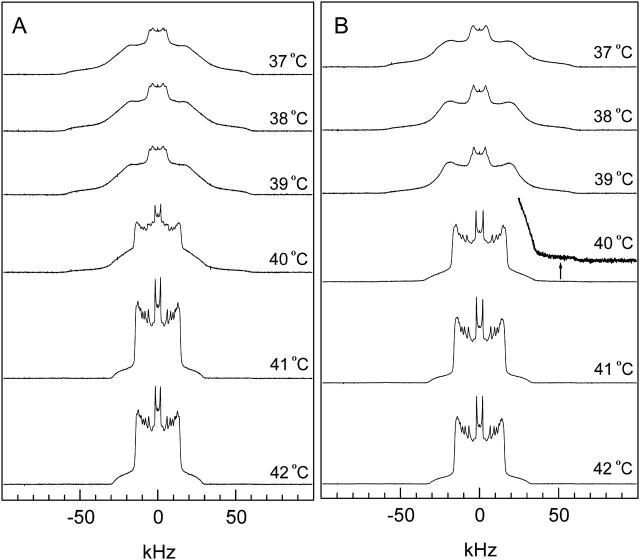
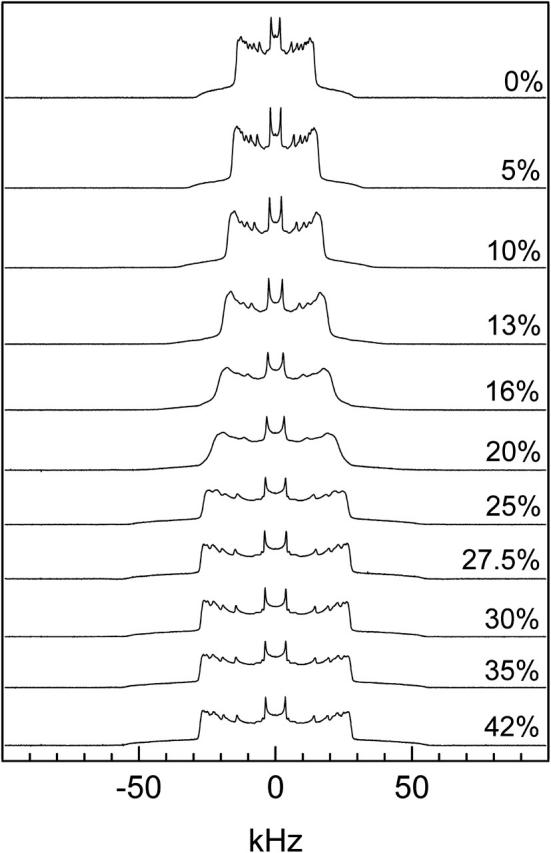
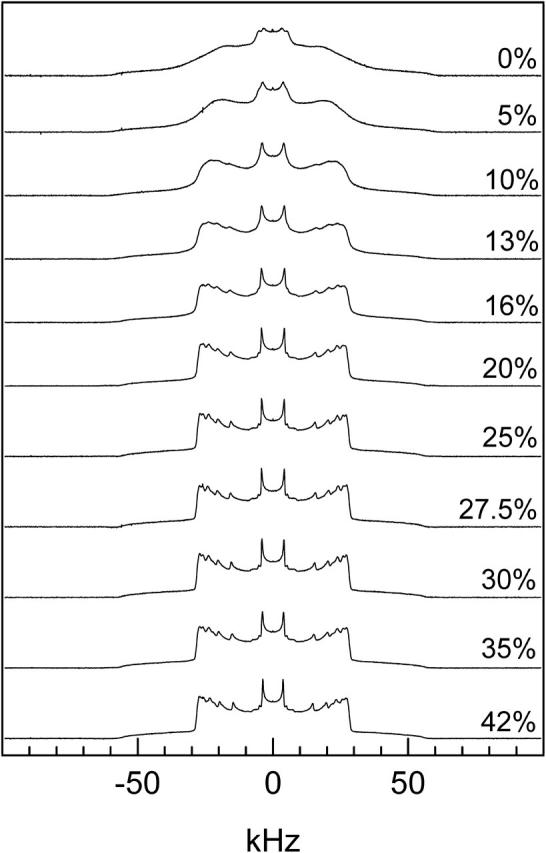
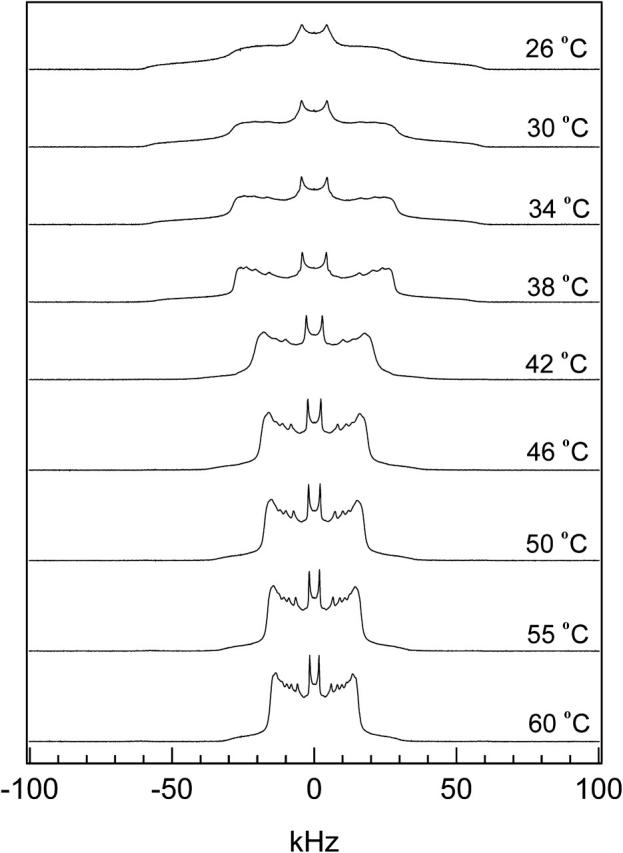
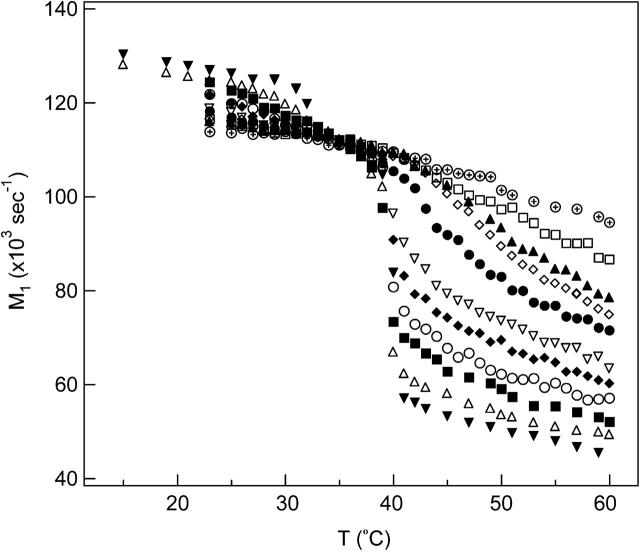
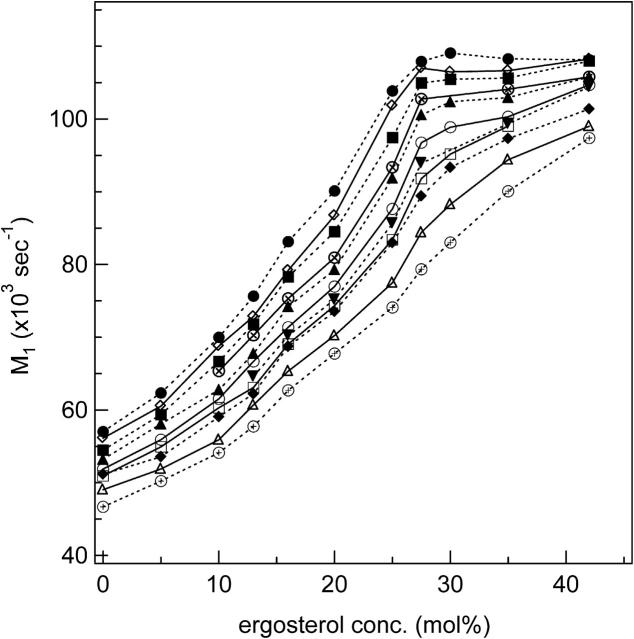
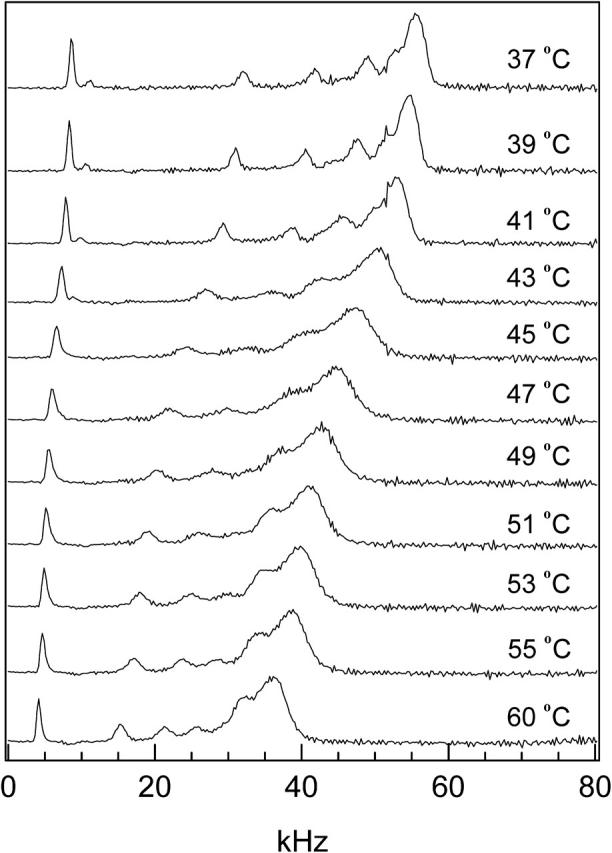
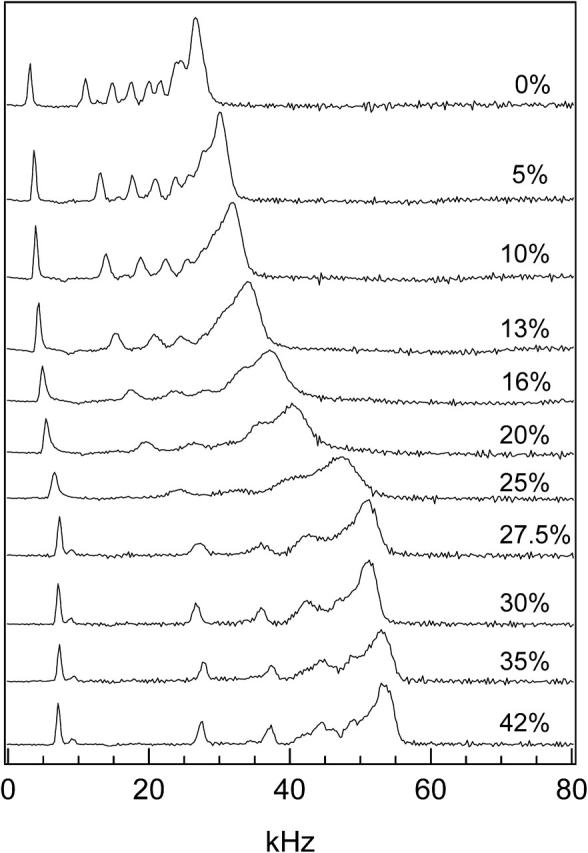
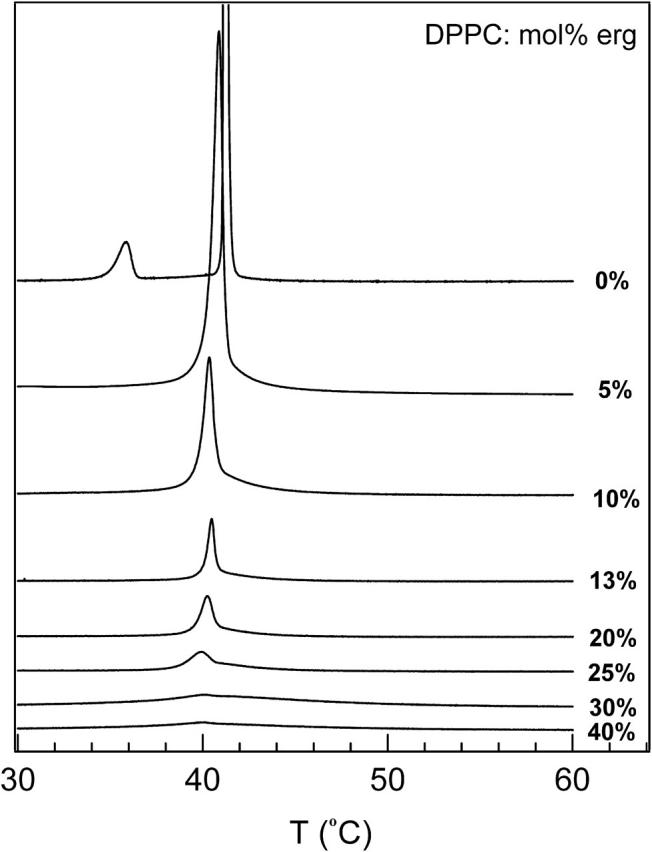
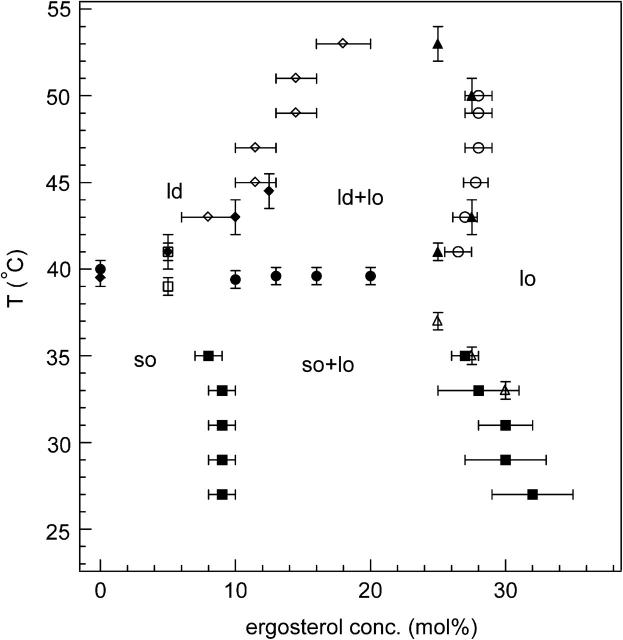
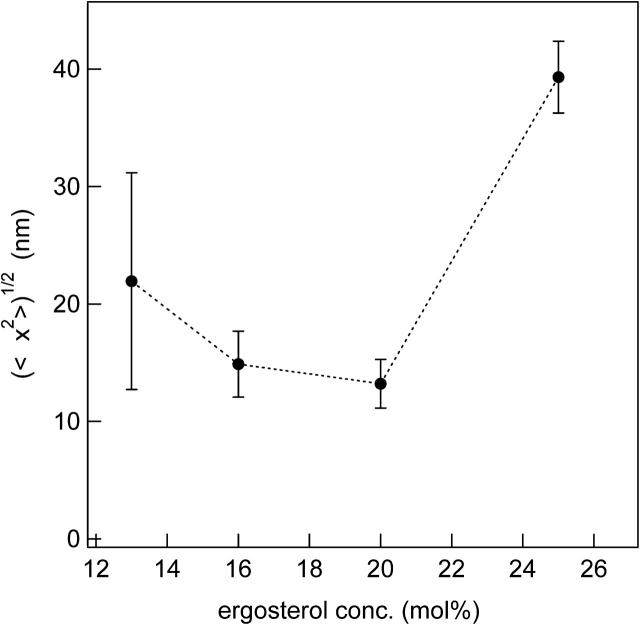
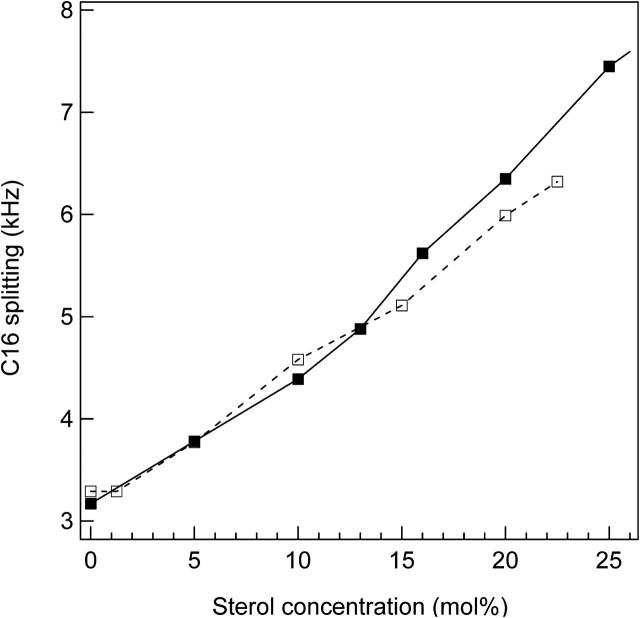
We have studied the effect of ergosterol, an important component of fungal plasma membranes, on the physical properties of dipalmitoylphosphatidylcholine (DPPC) multibilayers using deuterium nuclear magnetic resonance ((2)H NMR) and differential scanning calorimetry (DSC). For the (2)H NMR experiments the sn-1 chain of DPPC was perdeuterated and NMR spectra were taken as a function of temperature and ergosterol concentration. The phase diagram, constructed from the NMR spectra and the DSC thermograms, exhibits both solid-ordered (so) + liquid-ordered (lo) and liquid-disordered (ld) + lo phase coexistence regions with a clear three-phase line. This is the first demonstration that lo domains exist in liquid crystalline membranes containing ergosterol. The domain sizes in the ld+lo phase coexistence region were estimated by analyzing the exchange of labeled DPPC between the two regions, and depend on ergosterol concentration. The DPPC-ergosterol phase diagram is similar to that of the DPPC-cholesterol multibilayer system except that the so+lo and ld+lo phase coexistence regions are considerably broader.
Figures
Similar articles
-
A DSC and FTIR spectroscopic study of the effects of the epimeric 4-cholesten-3-ols and 4-cholesten-3-one on the thermotropic phase behaviour and organization of dipalmitoylphosphatidylcholine bilayer membranes: comparison with their 5-cholesten analogues.Chem Phys Lipids. 2014 Jan;177:71-90. doi: 10.1016/j.chemphyslip.2013.11.008. Epub 2013 Dec 1. Chem Phys Lipids. 2014. PMID: 24296232
-
Ergosterol in POPC membranes: physical properties and comparison with structurally similar sterols.Biophys J. 2007 Mar 1;92(5):1606-15. doi: 10.1529/biophysj.106.097345. Epub 2006 Dec 1. Biophys J. 2007. PMID: 17142279 Free PMC article.
-
The structuring effects of amphotericin B on pure and ergosterol- or cholesterol-containing dipalmitoylphosphatidylcholine bilayers: a differential scanning calorimetry study.Biochim Biophys Acta. 1998 Aug 14;1373(1):76-86. doi: 10.1016/s0005-2736(98)00083-2. Biochim Biophys Acta. 1998. PMID: 9733926
-
Membrane order perturbation in the presence of antimicrobial peptides by (2)H solid-state NMR spectroscopy.Biochimie. 2009 Jun;91(6):734-43. doi: 10.1016/j.biochi.2009.01.002. Biochimie. 2009. PMID: 19455745 Review.
-
Life During Wartime: A Personal Recollection of the Circa 1990 Prestegard Lab and Its Contributions to Membrane Biophysics.J Membr Biol. 2019 Dec;252(6):541-548. doi: 10.1007/s00232-019-00090-5. Epub 2019 Aug 30. J Membr Biol. 2019. PMID: 31471644 Free PMC article. Review.
Cited by
-
Theory of the deuterium NMR of sterol-phospholipid membranes.Proc Natl Acad Sci U S A. 2006 Jan 31;103(5):1184-9. doi: 10.1073/pnas.0510514103. Epub 2006 Jan 23. Proc Natl Acad Sci U S A. 2006. PMID: 16432189 Free PMC article.
-
Sterol targeting drugs reveal life cycle stage-specific differences in trypanosome lipid rafts.Sci Rep. 2017 Aug 22;7(1):9105. doi: 10.1038/s41598-017-08770-9. Sci Rep. 2017. PMID: 28831063 Free PMC article.
-
The effect of sterols on amphotericin B self-aggregation in a lipid bilayer as revealed by free energy simulations.Biophys J. 2013 Apr 2;104(7):1485-94. doi: 10.1016/j.bpj.2013.02.029. Biophys J. 2013. PMID: 23561525 Free PMC article.
-
Sterols and membrane dynamics.J Chem Biol. 2008 Nov;1(1-4):63-77. doi: 10.1007/s12154-008-0010-6. Epub 2008 Sep 23. J Chem Biol. 2008. PMID: 19568799 Free PMC article.
-
Long open amphotericin channels revealed in cholesterol-containing phospholipid membranes are blocked by thiazole derivative.J Membr Biol. 2014 Mar;247(3):211-29. doi: 10.1007/s00232-013-9626-8. Epub 2014 Jan 9. J Membr Biol. 2014. PMID: 24402241
References
-
- Bottema, C. D. K., R. J. Rodriguez, and L. W. Parks. 1985. Influence of sterol structure on yeast plasma membrane properties. Biochim. Biophys. Acta. 813:313–320. - PubMed
-
- Carrington, A., and A. D. McLachlan. 1967. Introduction to Magnetic Resonance. Harper & Row, New York, NY.
-
- Davis, J. H., K. R. Jeffrey, M. Bloom, M. I. Valic, and T. P. Higgs. 1976. Quadrupolar echo deuteron magnetic resonance spectroscopy in ordered hydrocarbon chains. Chem. Phys. Lett. 42:390–394.
Publication types
MeSH terms
Substances
LinkOut - more resources
Full Text Sources
Research Materials
