Strong binding of myosin heads stretches and twists the actin helix
- PMID: 15596509
- PMCID: PMC1305243
- DOI: 10.1529/biophysj.104.050047
Strong binding of myosin heads stretches and twists the actin helix
Abstract
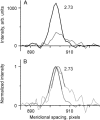
Calculation of the size of the power stroke of the myosin motor in contracting muscle requires knowledge of the compliance of the myofilaments. Current estimates of actin compliance vary significantly introducing uncertainty in the mechanical parameters of the motor. Using x-ray diffraction on small bundles of permeabilized fibers from rabbit muscle we show that strong binding of myosin heads changes directly the actin helix. The spacing of the 2.73-nm meridional x-ray reflection increased by 0.22% when relaxed fibers were put into low-tension rigor (<10 kN/m(2)) demonstrating that strongly bound myosin heads elongate the actin filaments even in the absence of external tension. The pitch of the 5.9-nm actin layer line increased by approximately 0.62% and that of the 5.1-nm layer line decreased by approximately 0.26%, suggesting that the elongation is accompanied by a decrease in its helical angle (approximately 166 degrees) by approximately 0.8 degrees. This effect explains the difference between actin compliance revealed from mechanical experiments with single fibers and from x-ray diffraction on whole muscles. Our measurement of actin compliance obtained by applying tension to fibers in rigor is consistent with the results of mechanical measurements.
Figures


Similar articles
-
X-ray diffraction evidence for the extensibility of actin and myosin filaments during muscle contraction.Biophys J. 1994 Dec;67(6):2422-35. doi: 10.1016/S0006-3495(94)80729-5. Biophys J. 1994. PMID: 7779179 Free PMC article.
-
Structural characterization of the binding of Myosin*ADP*Pi to actin in permeabilized rabbit psoas muscle.Biophys J. 2006 Nov 1;91(9):3370-82. doi: 10.1529/biophysj.106.086918. Epub 2006 Aug 11. Biophys J. 2006. PMID: 16905611 Free PMC article.
-
Temperature-induced structural changes in the myosin thick filament of skinned rabbit psoas muscle.Biophys J. 1997 Nov;73(5):2304-12. doi: 10.1016/S0006-3495(97)78262-6. Biophys J. 1997. PMID: 9370427 Free PMC article.
-
Visualizing myosin's power stroke in muscle contraction.J Cell Sci. 2000 Oct;113 ( Pt 20):3551-62. doi: 10.1242/jcs.113.20.3551. J Cell Sci. 2000. PMID: 11017871 Review.
-
Special Issue: The Actin-Myosin Interaction in Muscle: Background and Overview.Int J Mol Sci. 2019 Nov 14;20(22):5715. doi: 10.3390/ijms20225715. Int J Mol Sci. 2019. PMID: 31739584 Free PMC article. Review.
Cited by
-
Rear actomyosin contractility-driven directional cell migration in three-dimensional matrices: a mechano-chemical coupling mechanism.J R Soc Interface. 2014 Mar 19;11(95):20131072. doi: 10.1098/rsif.2013.1072. Print 2014 Jun 6. J R Soc Interface. 2014. PMID: 24647903 Free PMC article. Review.
-
Tropomyosin movement is described by a quantitative high-resolution model of X-ray diffraction of contracting muscle.Eur Biophys J. 2017 May;46(4):335-342. doi: 10.1007/s00249-016-1174-6. Epub 2016 Sep 17. Eur Biophys J. 2017. PMID: 27640143
-
The structural basis of the increase in isometric force production with temperature in frog skeletal muscle.J Physiol. 2005 Sep 1;567(Pt 2):459-69. doi: 10.1113/jphysiol.2005.089672. Epub 2005 Jun 16. J Physiol. 2005. PMID: 15961426 Free PMC article.
-
Actin filaments as tension sensors.Curr Biol. 2012 Feb 7;22(3):R96-101. doi: 10.1016/j.cub.2011.12.010. Curr Biol. 2012. PMID: 22321312 Free PMC article. Review.
-
Electron tomography of cryofixed, isometrically contracting insect flight muscle reveals novel actin-myosin interactions.PLoS One. 2010 Sep 9;5(9):e12643. doi: 10.1371/journal.pone.0012643. PLoS One. 2010. PMID: 20844746 Free PMC article.
References
-
- Bagni, M. A., G. Cecchi, F. Colomo, and C. Poggesi. 1990. Tension and stiffness of frog muscle fibres at full filament overlap. J. Muscle Res. Cell Motil. 11:371–377. - PubMed
-
- Bershitsky, S. Y., A. K. Tsaturyan, O. N. Bershitskaya, G. I. Mashanov, P. Brown, M. Webb, and M. A. Ferenczi. 1996. Mechanical and structural properties underlying contraction of skeletal muscle fibers after partial 1-ethyl-3-[(3-dimethylamino)propyl] carbodiimide cross-linking. Biophys. J. 71:1462–1474. - PMC - PubMed
-
- Borovikov, Y. S., I. V. Dedova, C. G. dos Remedios, N. N. Vikhoreva, P. G. Vikhorev, S. V. Avrova, T. L. Hazlett, and B. W. Van Der Meer. 2004. Fluorescence depolarization of actin filaments in reconstructed myofibers: the effect of S1 or pPDM-S1 on movements of distinct areas of actin. Biophys. J. 86:3020–3029. - PMC - PubMed
Publication types
MeSH terms
Substances
Grants and funding
LinkOut - more resources
Full Text Sources

