. 2005 Mar;88(3):2126-36.
doi: 10.1529/biophysj.104.048967. Epub 2004 Dec 13.

Fluorescence imaging for monitoring the colocalization of two single molecules in living cells

Affiliations

Fluorescence imaging for monitoring the colocalization of two single molecules in living cells

Ikuko Koyama-Honda et al. Biophys J. 2005 Mar.

Abstract

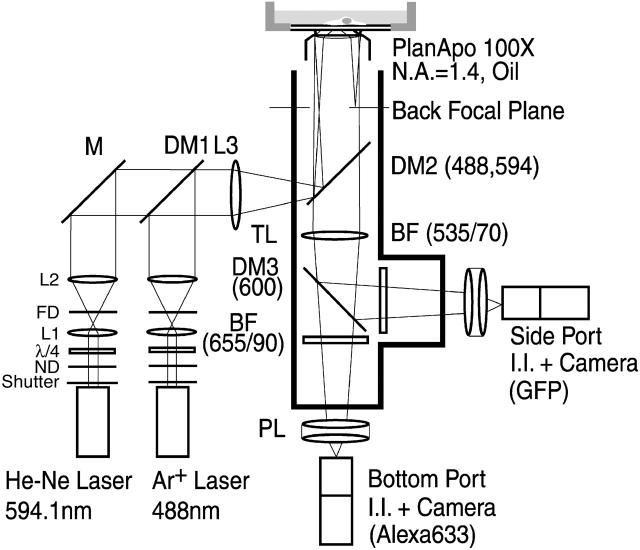
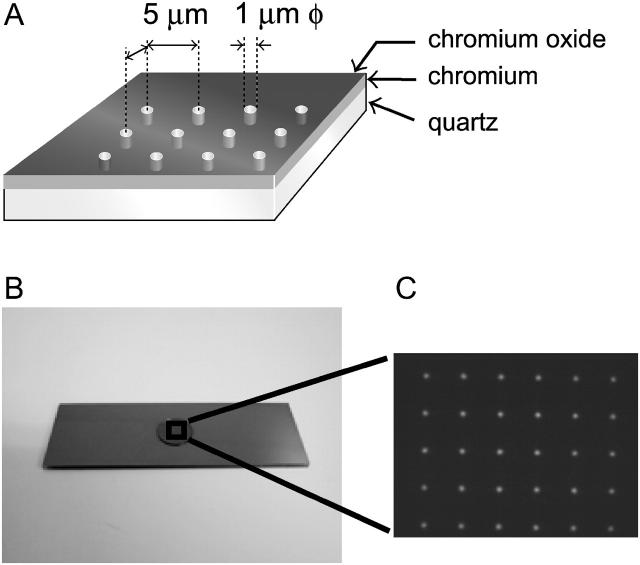
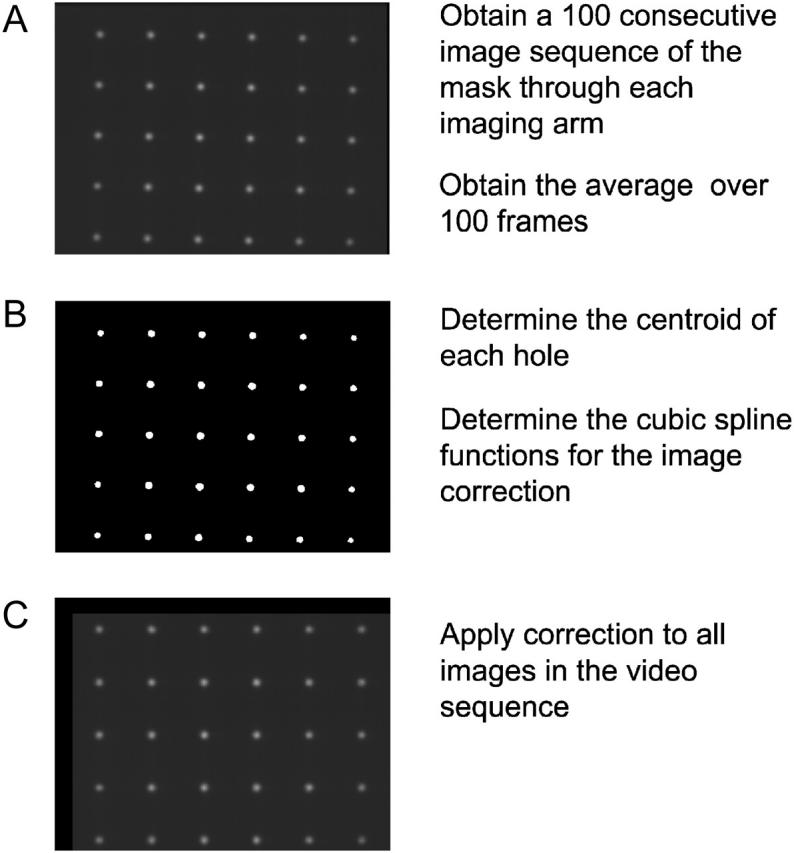
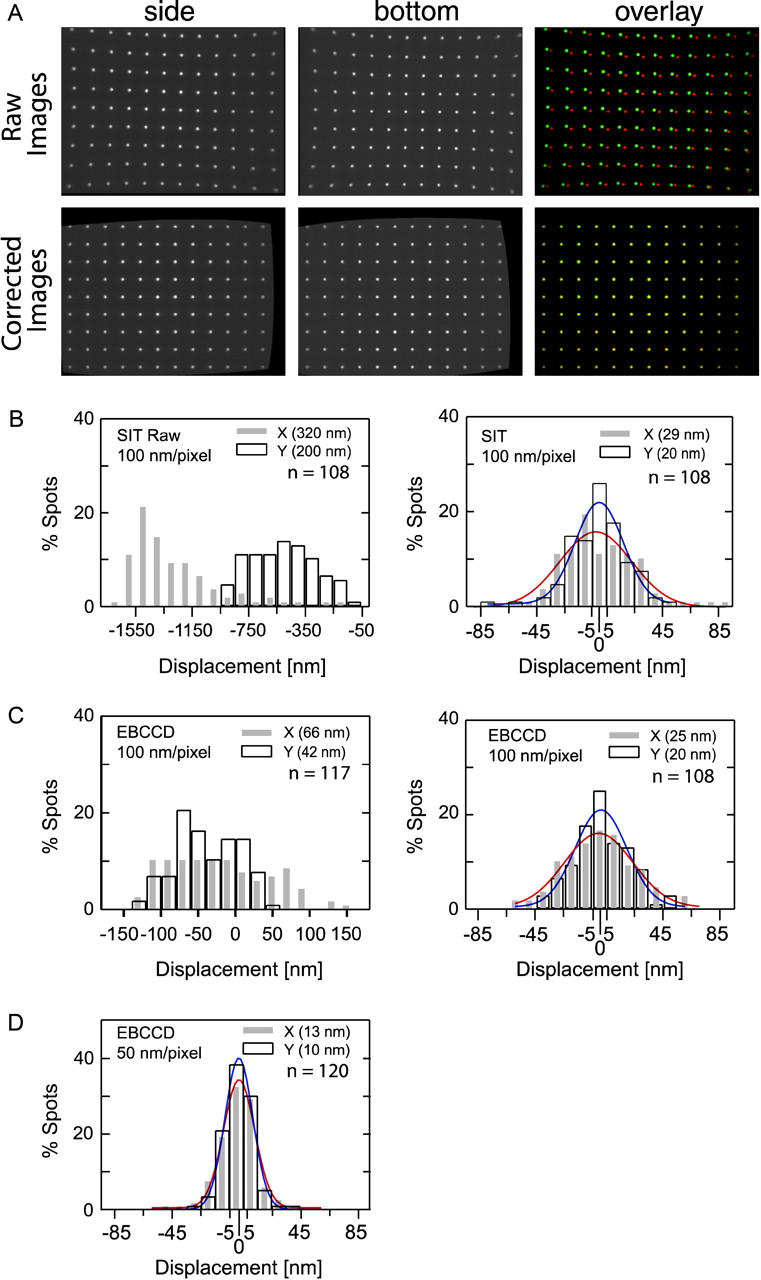
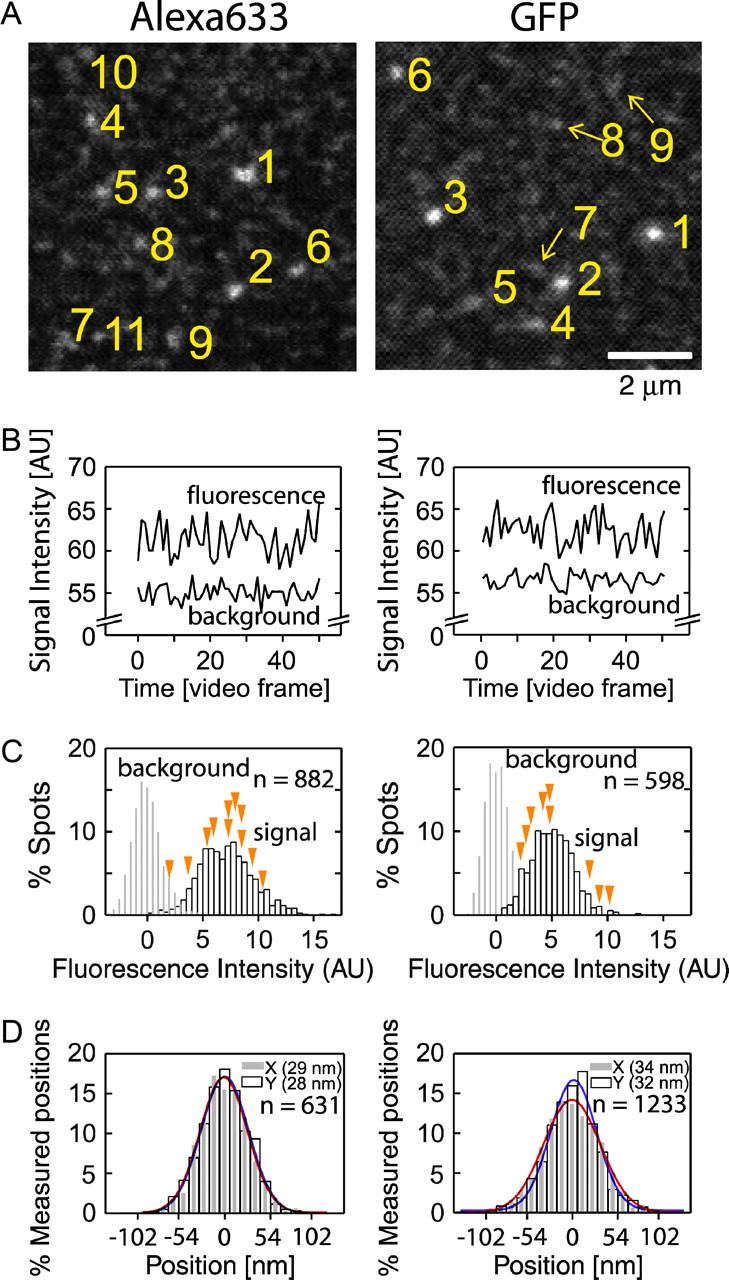
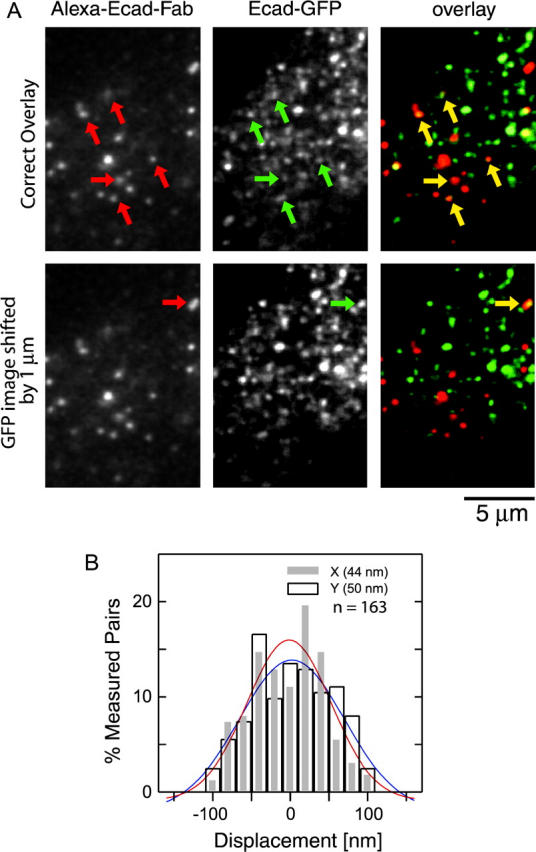
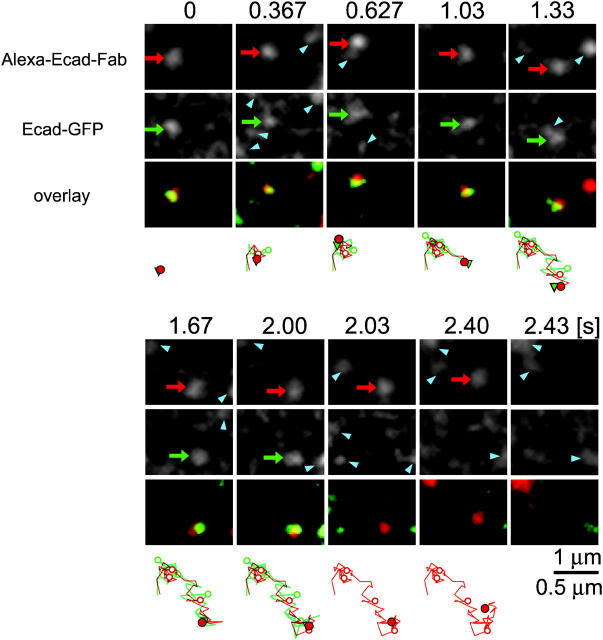
The interaction, binding, and colocalization of two or more molecules in living cells are essential aspects of many biological molecular processes, and single-molecule technologies for investigating these processes in live cells, if successfully developed, would become very powerful tools. Here, we developed simultaneous, dual-color, single fluorescent molecule colocalization imaging, to quantitatively detect the colocalization of two species of individual molecules. We first established a method for spatially correcting the two full images synchronously obtained in two different colors, and then for overlaying them with an accuracy of 13 nm. By further assessing the precision of the position determination, and the signal/noise and signal/background ratios, we found that two single molecules in dual color can be colocalized to within 64-100 nm (68-90% detectability) in the membrane of cells for GFP and Alexa633. The detectability of true colocalization at the molecular level and the erroneous inclusion of incidental approaches of two molecules as colocalization have to be compromised at different levels in each experiment, depending on its purpose. This technique was successfully demonstrated in living cells in culture, monitoring colocalization of single molecules of E-cadherin fused with GFP diffusing in the plasma membrane with single molecules of Alexa633 conjugated to anti-E-cadherin Fab externally added to the culture medium. This work established a benchmark for monitoring the colocalization of two single molecules, which can be applied to wide ranges of studies for molecular interactions, both at the levels of single molecules and collections of molecules.


Figures

FIGURE 1
FIGURE 1
The microscope setup for simultaneous, dual-color, fluorescence imaging of two single molecules of different species. The optics and lasers indicated in this figure are those for the simultaneous observation of the pair of GFP and Alexa633. For the observations of other dyes, this microscope is equipped with the second harmonic Nd-YAG (532 nm) and He-Cd (442 nm) lasers and other appropriate optical components. The excitation arm consists of the following optical components: S, electronic shutter; ND, neutral density filter; λ/4, quarter-wave plate; L1 and L2, working as a 10× beam expander (L1, f = 150 mm; L2, f = 15 mm) for 488-nm excitation, or 4× beam expander (L1, f = 80 nm; L2, f = 20 mm) for 594-nm excitation; FD, field diaphragm; M, mirror, DM, dichroic mirror; L3, focusing lens (f = 35 mm); BP, band-pass filter. The two-color fluorescence emission signal is split by a dichroic mirror (DM3) and detected by two cameras at the side and bottom ports. TL, tube lens (1× or 2×); BF, barrier filter; PL, projection lens (2×); I.I, image intensifier.
FIGURE 2
FIGURE 2
The mask used to spatially correct the dual-color images. (A) Schematic drawing, (B) the image, and (C) the magnified image of the mask. Layers of chromium and chromium oxide were deposited on a quartz slide glass. Photolithography was employed to make an array of holes.
FIGURE 3
FIGURE 3
Algorithm for the spatial correction of the imaging arms of the microscope.
FIGURE 4
FIGURE 4
Improvement of superpositioning accuracy of simultaneously obtained, dual-color, single fluorescent molecule images by the spatial correction method developed here. (A, top) Images of the grid slide glass taken by two SIT cameras (100 nm on the sample/pixel) at the side (for GFP) and the bottom (for Alexa633) ports, and their overlaid images before correction. (A, bottom) Same series as the top after the spatial correction, as shown in Fig. 3. The “white-light” bright-field transmission microscopy was used with the same observation arms and optics used for simultaneous fluorescence observations, for the correction of chromatic aberrations. (B, left) Based on the raw images (top images in A), the histograms of the displacements in the x- and y-directions for all of the visible grid holes were obtained. The average displacements are −1300 ± 320 nm (x-direction, shaded bar) and −500 ± 230 nm (y-direction, open bar). The mean varies each time the dichroic mirrors or the cameras are reset, but the standard deviations (3.2 and 2.3 pixels in x- and y-directions, respectively) generally stay the same. (B, right) Based on the corrected images (bottom images in A), the histograms of the average displacements in the x- and y-directions for all of the visible grid holes were obtained. The average displacements are 0.9 ± 29 nm (x, shaded bar) and −0.9 ± 20 nm (y, open bar) (standard deviations 0.29 and 0.20 pixels in the x- and y-directions, respectively). The histograms were fitted by Gaussian curves (x, red line; y, blue line). (C) The same as panel B, but EBCCD cameras (100 nm on the sample/pixel) were used. (Left) The average displacements are −20 ± 66 nm and −39 ± 42 nm for the x- (shaded) and y- (open) directions, respectively, in this particular setting. Standard deviations are generally the same after resetting of the dichroic mirror and the camera, and are 0.66 and 0.42 pixels in the x- and y-directions, respectively. (Right) After the spatial correction. The average displacements are −1.1 ± 25 nm and 1.1 ± 20 nm in the x- and y-directions, respectively. Standard deviations were improved to 0.25 and 0.2 pixels. (D) EBCCD camera at 50 nm on the sample/pixel after the spatial correction. This is our standard condition used for simultaneous, dual-color, observations of single molecules. The standard deviations in terms of the pixels remained the same, but in the actual measurement, they were improved (scaled in proportion to the magnification) to 13 and 10 nm for the x- (shaded) and y- (open) directions, respectively.
FIGURE 5
FIGURE 5
Simultaneous, dual-color, single-molecule observations of Alexa633 conjugated to anti-CD59 Fab fragments (Alexa633-Fab; left column; bottom port) and GFP (right column; side port) immobilized on the coverslips, to assess the signal/noise and signal/background ratios and the precision in determining the positions of these molecules. (A) Raw images of Alexa633-Fab and GFP adsorbed on coverslips. Scale bar = 2 μm. Single fluorescence spots are numbered in descending order of the signal intensity. (B) Typical fluorescence intensities of single molecules of Alexa633 and GFP, and the background intensities adjacent to the single-molecule spots, plotted as a function of time (video frames). (C) The distribution of the fluorescence signal intensity (after background subtraction for individual spots) and the background signal intensity (after subtraction of the mean value of the background signal). Yellow arrowheads indicate the intensities of the numbered fluorescence spots in panel A. (D) Histograms for the precisions in determining the coordinates of single fluorophores under the conditions of simultaneous, dual-color, single-fluorescent-molecule video observations (x, shaded bars; y, open bars). For ease of comparison, the mean value was subtracted from each determined value. The standard deviations of the distributions were 29 and 28 nm for Alexa633 (n = 631 determinations, 14 fluorophores) and 34 and 32 nm for GFP (n = 1233 determinations, 32 fluorophores) in the x- (Gaussian fit in red line) and y- (Gaussian fit in blue line) directions, respectively.
FIGURE 6
FIGURE 6
Simultaneous, dual-color, fluorescence observations of single molecules of Alexa-αEcad-Fab (red, bottom port) bound to Ecad-GFP (green, side port) on a fixed L cell. (A, top) Representative synchronously obtained, spatially corrected images of Alexa-αEcad-Fab (left) and Ecad-GFP (middle), and their overlaid images (right). For this display, only a small part of a typical 640- × 480-pixel image is shown (and, therefore, the number of colocalized spots is small in these figures). Arrows show colocalized spots (within 100 nm of each other). Only the spots with single-molecule fluorescence intensities were selected. (A, bottom) As a control, the corrected E-cad-GFP image was shifted toward left by 1 μm and overlaid with the corrected image of Alexa-αEcad-Fab. Only one incidental overlap (shown by a yellow arrow) was found here. The scale bar indicates 5 μm. (B) The distributions of the x- and y-displacements for pairs found to be separated within 100 nm (note that this is the true distance between the two spots, rather than the displacements in the x- and y-directions). All of the spots with single-molecule signal intensities were identified in each color (eight independent images for each color). The distances of all pairs of green and red spots in the synchronous images were measured, and those within 100 nm were selected (163 pairs). The standard deviations of the displacements for these pairs were 44 and 50 nm in the horizontal (Gaussian fit in red line) and vertical (Gaussian fit in blue line) directions, respectively.
FIGURE 7
FIGURE 7
Detection of colocalization of single molecules diffusing in the plasma membrane of living cells. Ecad-GFP (green) and Alexa-αEcad-Fab (red) on the living L-cell surface were simultaneously imaged using dual-color, single-molecule, fluorescence video imaging (observed at the normal video rate of 30 Hz). Spatially corrected, superimposed video images (see Supplementary Material) are shown. A green fluorescent spot, representing an Ecad-GFP molecule (indicated by green arrows), was colocalized with a red Alexa-αEcad-Fab spot (indicated by red arrows). Other spots representing single molecules are shown by blue arrowheads. The fluorescence intensities appear to vary greatly from spot to spot, but they rather represent time-dependent changes of the intensity, due to the spatiotemporal fluctuations of the signal intensification level of the image intensifier. The selected colocalized spots (indicated by green and red arrows) are those that exhibited relatively small variations in intensity during the observation period. Beneath each image, the concurrent positions (green triangles and red circles) and the trajectories of these spots are shown (note the different scales; the bar indicates 1 μm for the images and 0.5 μm for the trajectories). An Ecad-GFP molecule and an Alexa-αEcad-Fab molecule diffused together on the cell membrane for 2 s, keeping their distances basically within 100 nm. The open circles in the trajectories indicate the coordinates where the red and green spots lost colocalization, but which is limited for a single frame (see text). There are four circles in each trajectory (which is 61 frames long). The Ecad-GFP molecule showed a one-step photobleaching in one video frame (2.00–2.03 s), but the Alexa-αEcad-Fab molecule was still observable and kept diffusing for another 0.4 s until finally it was photobleached (or released from the cell surface) over a single video frame (2.40–2.43 s). At 2.03 and 2.40 s, the green trajectories are not shown to indicate that the green spot was photobleached, and likewise, the red trajectory is not shown at the last time point (2.43 s)

Comment in

Similar articles

Cited by

References

    1. Anderson, C. M., G. N. Georgiou, I. E. Morrison, G. V. Stevenson, and R. J. Cherry. 1992. Tracking of cell surface receptors by fluorescence digital imaging microscopy using a charge-coupled device camera. Low-density lipoprotein and influenza virus receptor mobility at 4 degrees C. J. Cell Sci. 101:415–425. - PubMed
    1. Chang, C. H., H. Takeuchi, T. Ito, K. Machida, and S. Ohnishi. 1981. Lateral mobility of erythrocyte membrane proteins studied by the fluorescence photobleaching recovery technique. J. Biochem. (Tokyo). 90:997–1004. - PubMed
    1. Cheezum, M. K., W. F. Walker, and W. H. Guilford. 2001. Quantitative comparison of algorithms for tracking single fluorescent particles. Biophys. J. 81:2378–2388. - PMC - PubMed
    1. Derrick, J. P., and D. B. Wigley. 1994. The third IgG-binding domain from streptococcal protein G. An analysis by X-ray crystallography of the structure alone and in a complex with Fab. J. Mol. Biol. 243:906–918. - PubMed
    1. Fujiwara, T., K. Ritchie, H. Murakoshi, K. Jacobson, and A. Kusumi. 2002. Phospholipids undergo hop diffusion in compartmentalized cell membrane. J. Cell Biol. 157:1071–1081. - PMC - PubMed

Publication types

MeSH terms

LinkOut - more resources