

2H-NMR study and molecular dynamics simulation of the location, alignment, and mobility of pyrene in POPC bilayers
- PMID: 15596514
- PMCID: PMC1305236
- DOI: 10.1529/biophysj.104.052399
2H-NMR study and molecular dynamics simulation of the location, alignment, and mobility of pyrene in POPC bilayers
Abstract
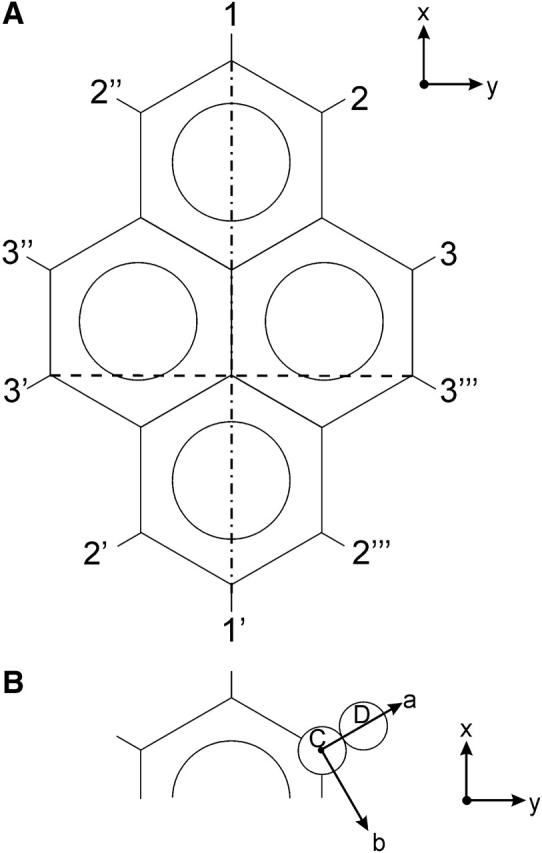
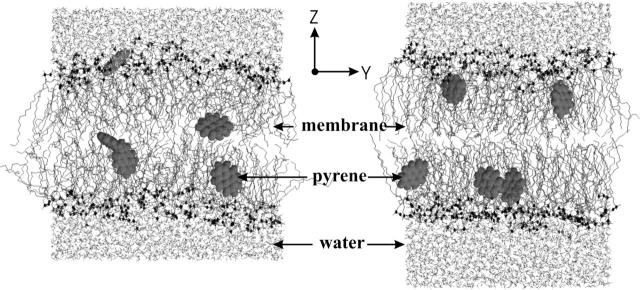
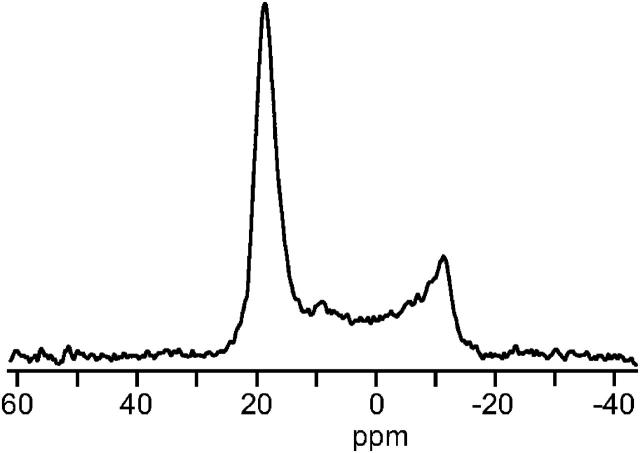
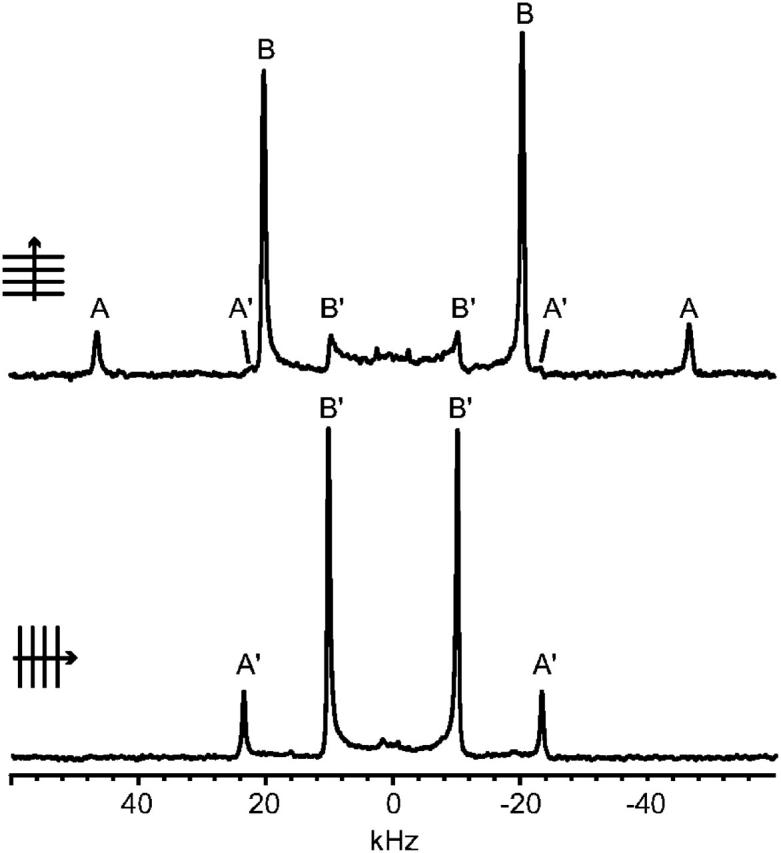
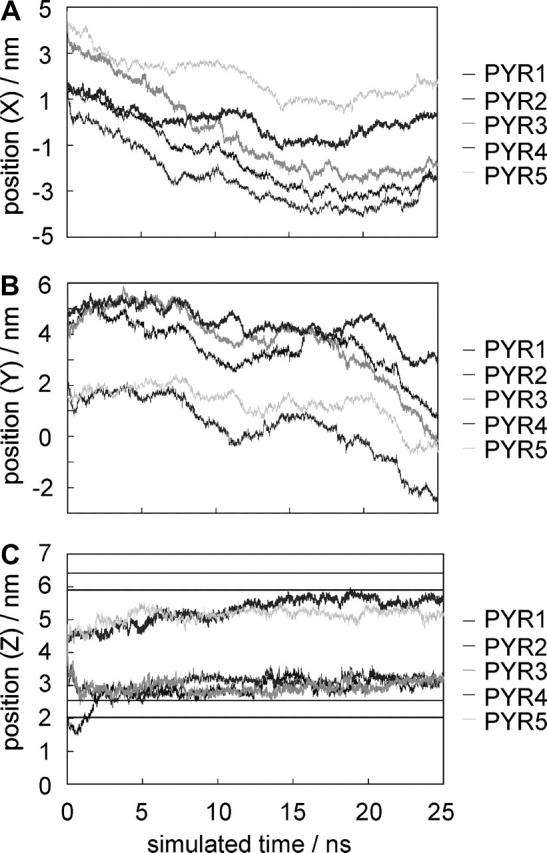
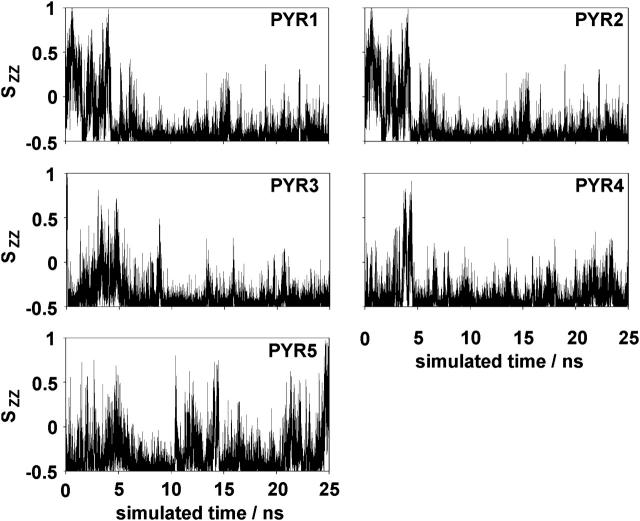
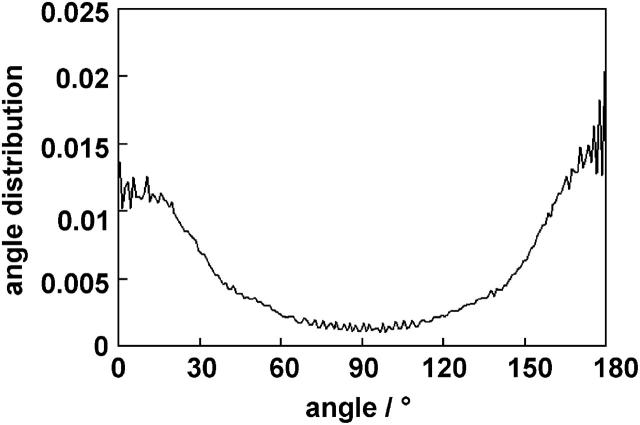
The alignment of pyrene in a 1-palmitoyl-2-oleoyl-phosphatidylcholine bilayer was investigated using two different approaches, namely solid-state (2)H-NMR spectroscopy and molecular dynamics (MD) simulations. Quadrupolar splittings from (2)H-NMR spectra of deuterated pyrene-d(10) in an oriented lipid bilayer give information about the orientation of C-D bonds with respect to the membrane normal. From MD simulations, geometric information is accessible via trajectories. By defining molecular and bond order parameters, the data from MD trajectories and NMR spectra can be compared straightforwardly. To ensure that the results from both methods are comparable, parameters of the experimental and the simulation setup were chosen to be as similar as possible. From simulations, we saw that pyrene prefers a position inside the lipid membrane near the headgroups and has no tendency to diffuse from one monolayer of the membrane to the other. The results from simulation and NMR show that the normal of the molecular plane is aligned nearly perpendicular to the bilayer normal. The long axis of pyrene lies preferentially parallel to the bilayer normal within a range of +/-30 degrees . The results from the two different methods are remarkably consistent. The good agreement can be explained by the fact that the different kind of motions of a pyrene molecule are already averaged within a few nanoseconds, which is the timescale covered by the MD simulation.
Figures
References
-
- Abragam, A. 1983. The Principles of Nuclear Magnetism. Oxford University Press, Oxford.
-
- Anezo, C., A. H. de Vries, H.-D. Holtje, D. P. Tieleman, and S.-J. Marrink. 2003. Methodological issues in lipid bilayer simulations. J. Phys. Chem. B. 107:9424–9433.
-
- Bassolino-Klimas, D., H. E. Alper, and T. R. Stouch. 1993. Solute diffusion in lipid membranes: an atomic level study by molecular dynamics simulation. Biochemistry. 32:12624–12637. - PubMed
-
- Bassolino-Klimas, D., H. E. Alper, and T. R Stouch. 1995. Mechanism of solute diffusion through lipid bilayer membranes by molecular dynamics simulation. J. Am. Chem. Soc. 117:4118–4129. - PubMed
-
- Baumgart, T., S. T. Hess, and W. W. Webb. 2003. Imaging coexisting fluid domains in biomembrane models coupling curvature and line tension. Nature. 425:821–824. - PubMed
Publication types
MeSH terms
Substances
LinkOut - more resources
Full Text Sources
