. 2004 Dec 20;200(12):1635-46.
doi: 10.1084/jem.20031958. Epub 2004 Dec 13.

Intestinal epithelial cells synthesize glucocorticoids and regulate T cell activation

Affiliations

Intestinal epithelial cells synthesize glucocorticoids and regulate T cell activation

Igor Cima et al. J Exp Med. .

Abstract

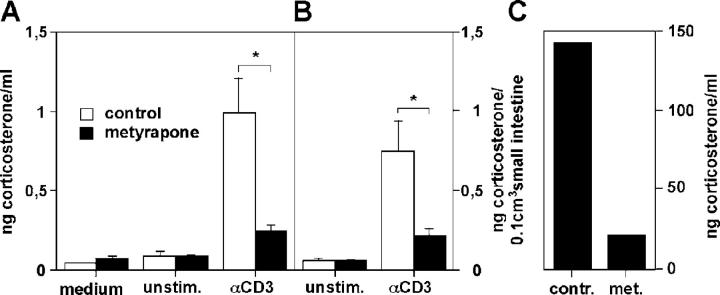
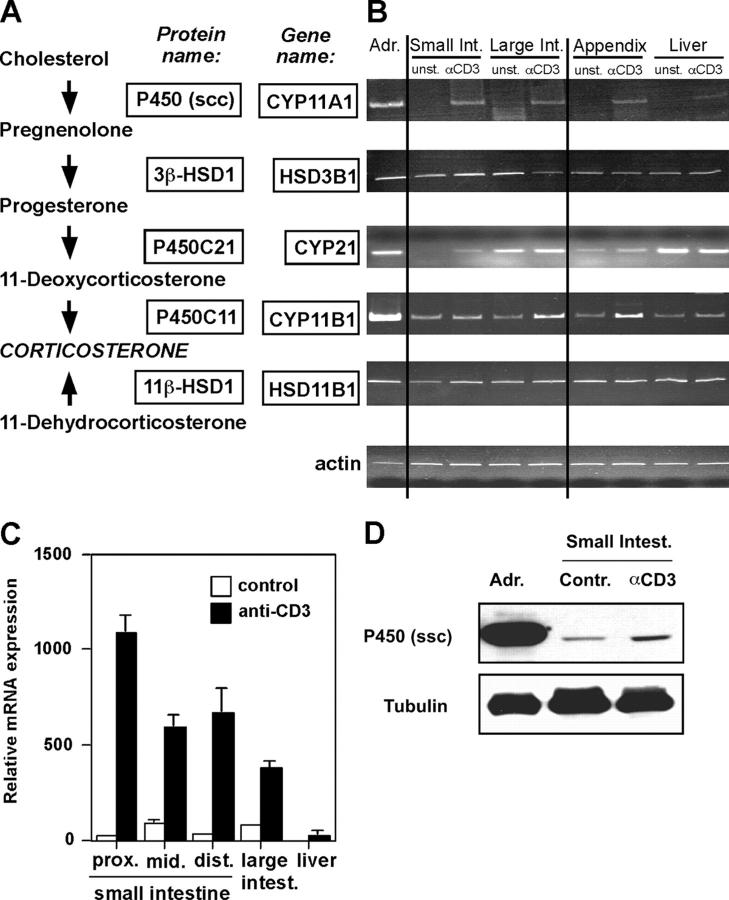
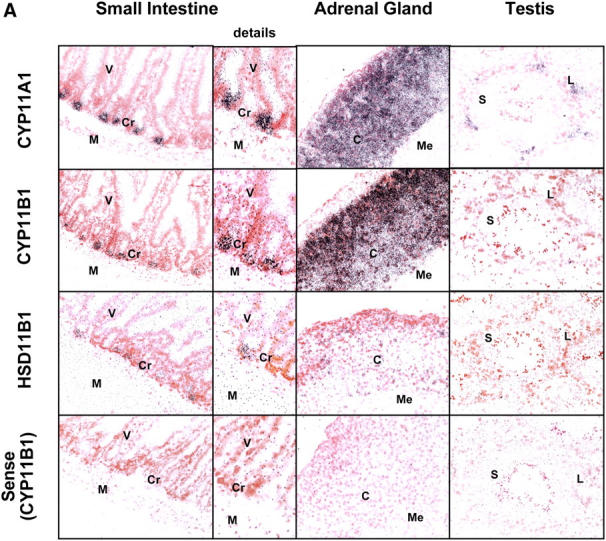
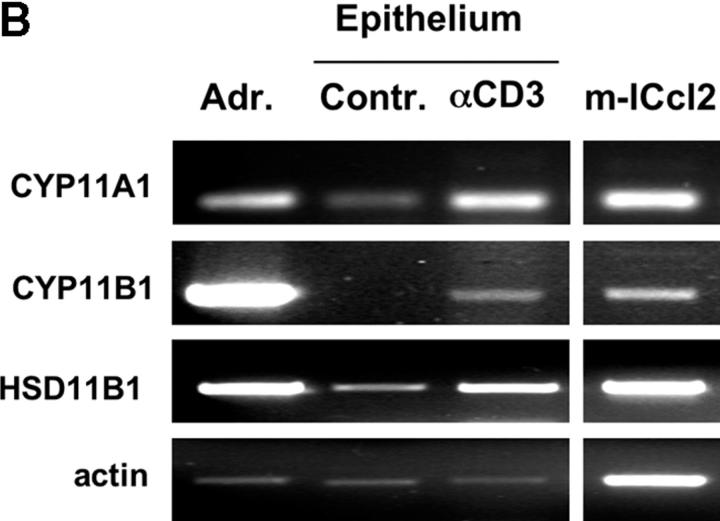
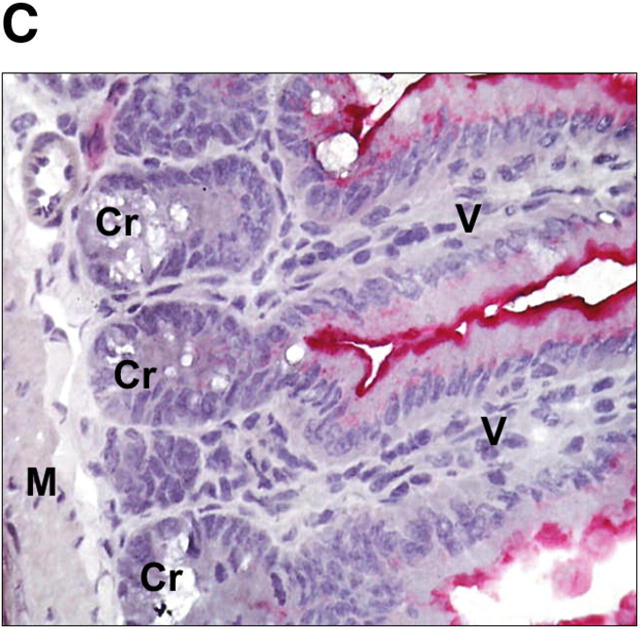
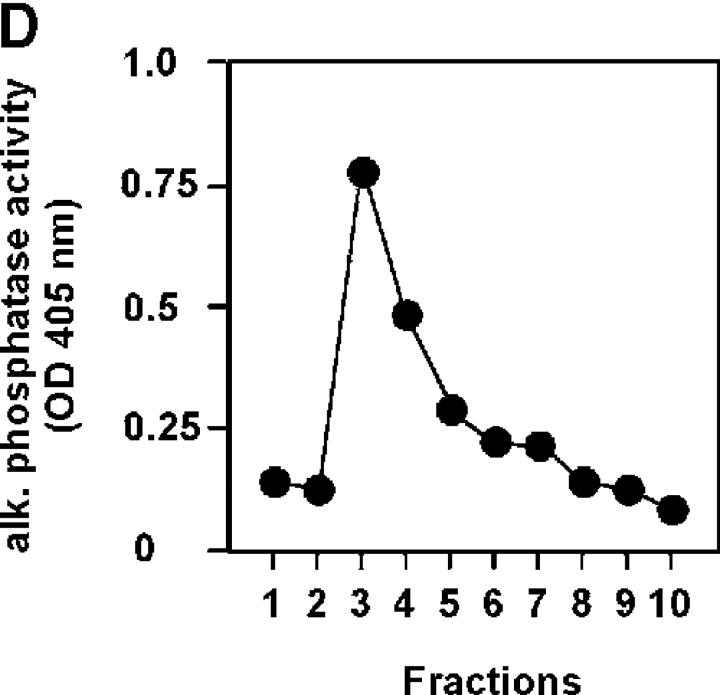
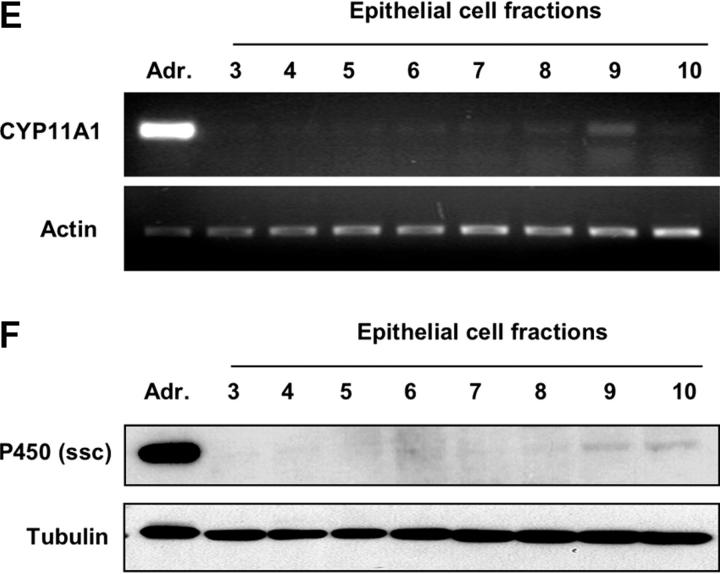
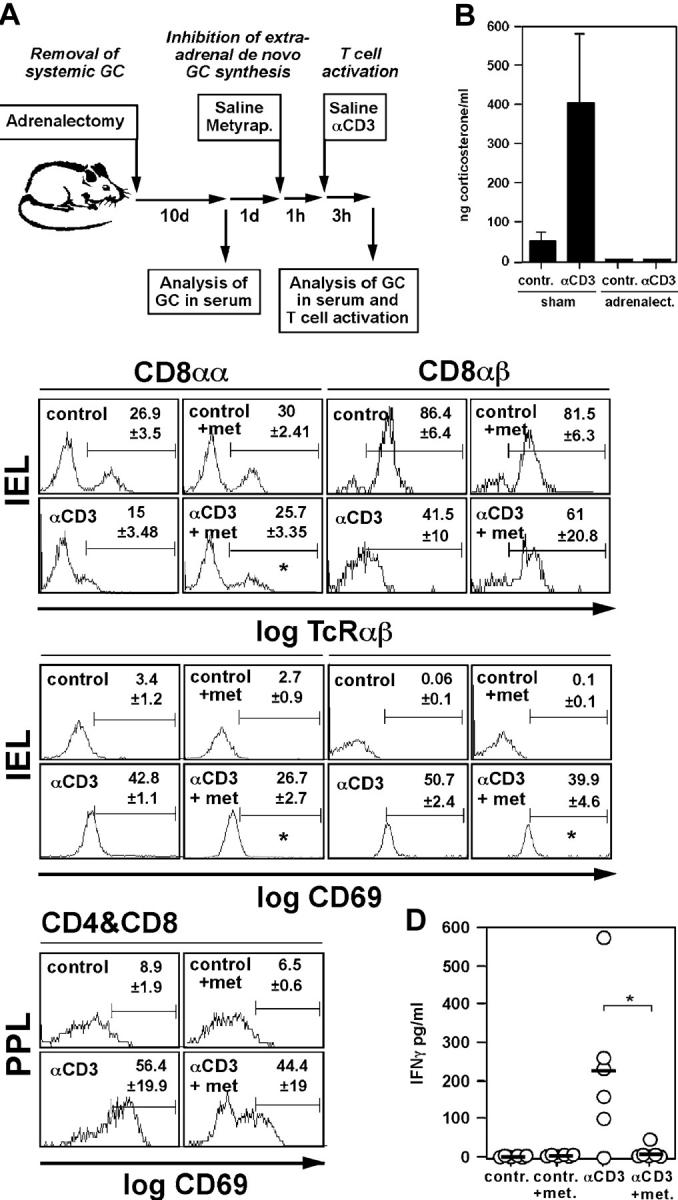
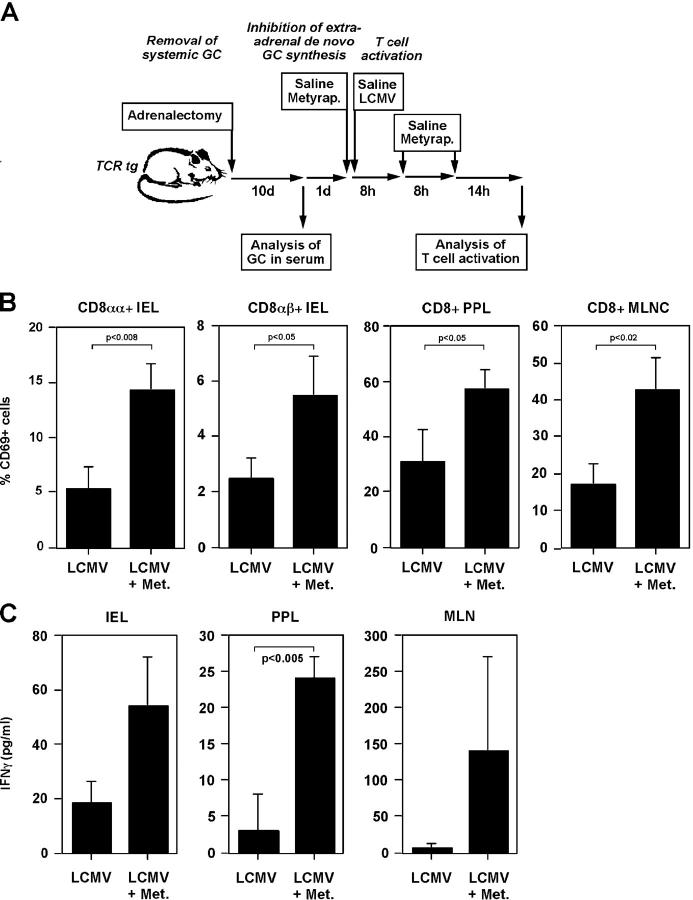
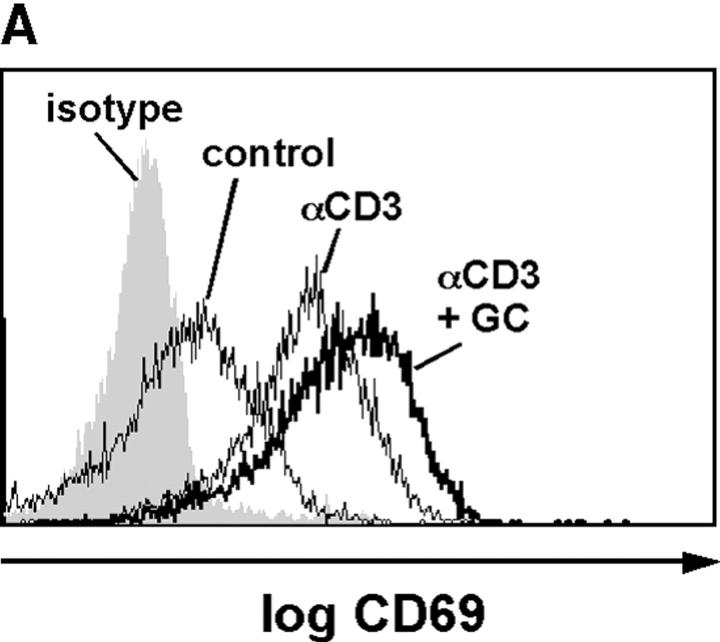
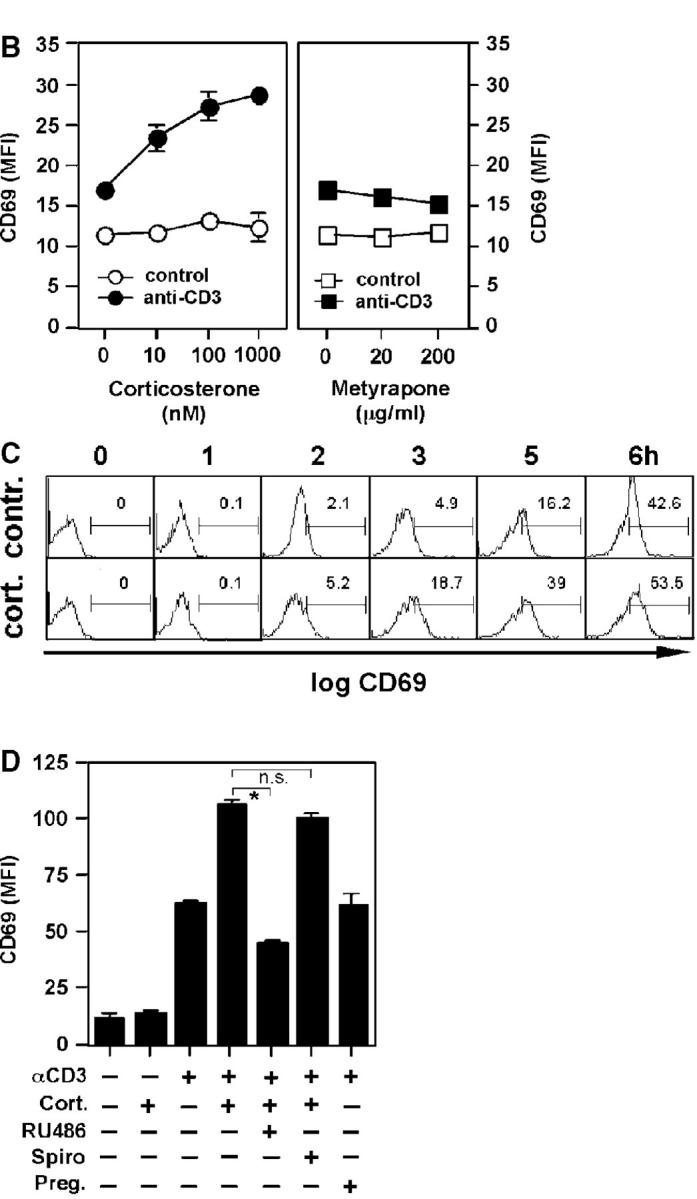
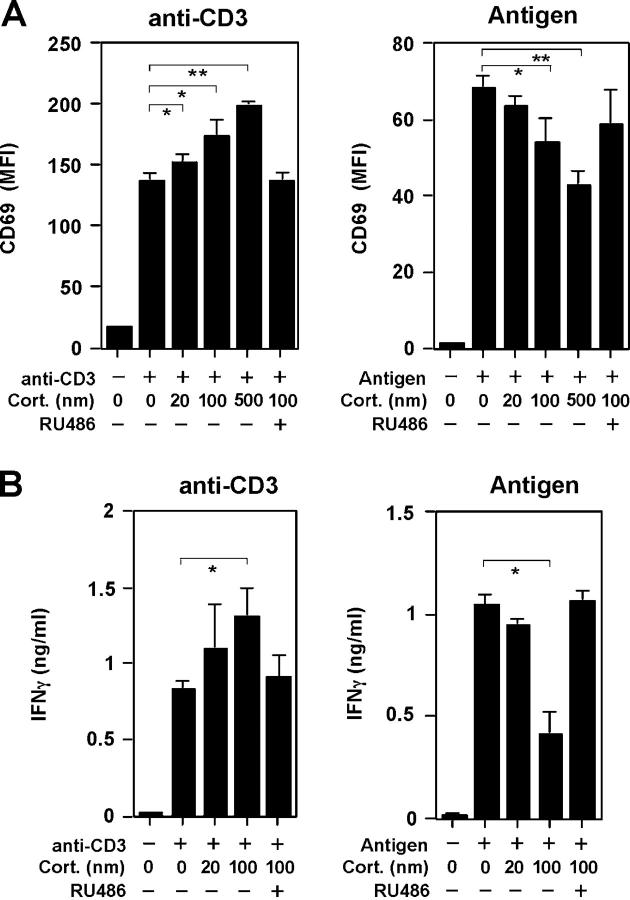
Glucocorticoids (GCs) are important steroid hormones with widespread activities in metabolism, development, and immune regulation. The adrenal glands are the major source of GCs and release these hormones in response to psychological and immunological stress. However, there is increasing evidence that GCs may also be synthesized by nonadrenal tissues. Here, we report that the intestinal mucosa expresses steroidogenic enzymes and releases the GC corticosterone in response to T cell activation. T cell activation causes an increase in the intestinal expression of the steroidogenic enzymes required for GC synthesis. In situ hybridization analysis revealed that these enzymes are confined to the crypt region of the intestinal epithelial layer. Surprisingly, in situ-produced GCs exhibit both an inhibitory and a costimulatory role on intestinal T cell activation. In the absence of intestinal GCs in vivo, activation by anti-CD3 injection resulted in reduced CD69 expression and interferon-gamma production by intestinal T cells, whereas activation by viral infection led to increased T cell activation. We conclude that the intestinal mucosa is a potent source of immunoregulatory GCs.


Figures

Figure 1.
Figure 1.
Corticosterone synthesis by the intestinal mucosa. (A) Small intestinal tissue from control mice (unstim.) or anti-CD3–injected mice (αCD3) were cultured ex vivo for 5 h in the presence or absence of metyrapone. Corticosterone in the cell-free supernatant was measured by RIA. (B) Presentation of the data shown in A as ng corticosterone per 0.1 cm3 small intestinal tissue. Mean values of triplicates of a typical experiment out of five are shown. An asterisk indicates P < 0.05 as assessed by the unpaired Student's t test. (C) Isolated adrenal glands were cultured with control medium or metyrapone (met.) for 5 h, and corticosterone released into the supernatant was assessed by RIA. A typical experiment out of four is shown.
Figure 2
Figure 2
Detection of steroidogenic enzyme expression in intestinal tissue. (A) A simplified scheme of the biosynthesis pathway from cholesterol to corticosterone. The protein and gene names of the enzymes involved in the specific biosynthesis steps are boxed. (B) Adrenal glands, small and large intestine, appendix, and liver from control mice or anti-CD3–injected mice were isolated, and gene expression of steroidogenic enzymes was assessed by RT-PCR. Equal loading was controlled by amplification of actin. A typical experiment out of four is shown. (C) Detection of CYP11A1 expression in different sections of the small intestine (proximal [prox.], middle [mid.], distal [dist.]), the large intestine, and the liver by quantitative real-time RT-PCR. A typical experiment out of two is shown. (D) Detection of P450 (ssc) protein. Protein extracts from adrenal gland (positive control) or small intestine from control or anti-CD3–treated mice were assessed for P450 (ssc) expression by Western blot. Equal protein loading was confirmed by the detection of tubulin. Adr., adrenal glands; Contr., control.
Figure 3.
Figure 3.
Localization of steroidogenic enzyme expression in small intestinal crypt cells. (A) In situ hybridization for steroidogenic enzymes. Tissue sections from small intestine, adrenal glands, and testis were hybridized with radiolabeled antisense probes for CYP11A1, CYP11B1, and HSD11B1. Unspecific binding was controlled using the CYP11B1 sense probe. M, muscularis; Cr, crypts; V, villi; C, cortex; Me, medulla; L, Leydig cells; S, Sertoli cells. A typical experiment out of two is shown. (B) Detection of steroidogenic enzyme expression in isolated epithelial cells. CYP11A1, CYP11B1, HSD11B1, and actin expression in adrenal glands (Adr.), isolated epithelial cells from control (contr.) and anti-CD3–injected mice (αCD3), or the murine epithelial crypt cell line m-ICc12 was assessed by RT-PCR. (C) Detection of endogenous alkaline phosphatase on small intestinal tissue sections. The luminal site of the epithelial layer stains red for alkaline phosphatase activity, whereas crypt cells are negative. V, villus; Cr, crypts; M, muscularis. (D) Analysis of alkaline phosphatase activity in differentially isolated epithelial cell fractions. Fraction 3 corresponds to the top villus fraction; fraction 10 corresponds to the bottom crypt cell fraction. (E) Analysis of CYP11A1 mRNA expression in the different epithelial cell fractions by RT-PCR. Equal amounts of RNA were confirmed by the detection of actin mRNA. (F) Detection of P450 (ssc) protein in the different epithelial cell fractions by Western blot. Equal protein loading was confirmed by the detection of tubulin.
Figure 3.
Figure 3.
Localization of steroidogenic enzyme expression in small intestinal crypt cells. (A) In situ hybridization for steroidogenic enzymes. Tissue sections from small intestine, adrenal glands, and testis were hybridized with radiolabeled antisense probes for CYP11A1, CYP11B1, and HSD11B1. Unspecific binding was controlled using the CYP11B1 sense probe. M, muscularis; Cr, crypts; V, villi; C, cortex; Me, medulla; L, Leydig cells; S, Sertoli cells. A typical experiment out of two is shown. (B) Detection of steroidogenic enzyme expression in isolated epithelial cells. CYP11A1, CYP11B1, HSD11B1, and actin expression in adrenal glands (Adr.), isolated epithelial cells from control (contr.) and anti-CD3–injected mice (αCD3), or the murine epithelial crypt cell line m-ICc12 was assessed by RT-PCR. (C) Detection of endogenous alkaline phosphatase on small intestinal tissue sections. The luminal site of the epithelial layer stains red for alkaline phosphatase activity, whereas crypt cells are negative. V, villus; Cr, crypts; M, muscularis. (D) Analysis of alkaline phosphatase activity in differentially isolated epithelial cell fractions. Fraction 3 corresponds to the top villus fraction; fraction 10 corresponds to the bottom crypt cell fraction. (E) Analysis of CYP11A1 mRNA expression in the different epithelial cell fractions by RT-PCR. Equal amounts of RNA were confirmed by the detection of actin mRNA. (F) Detection of P450 (ssc) protein in the different epithelial cell fractions by Western blot. Equal protein loading was confirmed by the detection of tubulin.
Figure 4.
Figure 4.
In situ–produced GCs regulate intestinal T cell activation in vivo. (A) Schematic overview of the in vivo experiments. Mice were adrenalectomized to remove the major source of systemic GCs. After 10 d recovery, animals were pretreated for 1 h with saline or metyrapone before injection of saline or anti-CD3 to activate T cells in vivo. After 3 h, GCs in the serum and the activation status of intestinal T cells were assessed. (B) Adrenalectomized animals fail to secrete GCs into the serum upon immune stimulation. Control mice (sham) or adrenalectomized animals were treated with saline (contr.) or anti-CD3, and corticosterone levels in the serum were assessed after 3 h (mean values ± SD of six mice per group). (C) Animals were treated as shown in A. IELs and PPLs were isolated and TCRαβ and CD69 expression on the CD8αα and CD8αβ subsets (IEL), or CD69 expression on CD4+ and CD8+ T cells (PPL), was monitored by flow cytometry. A typical experiment out of four is shown. Numbers indicate mean values of the percentage of positive cells in the indicated gates of three animals per group. An asterisk indicates a p-value of <0.05 for αCD3 vs. αCD3+ metyrapone. Note that TCRαβ in the CD8αα+ IEL population are TCRγδ+ T cells. (D) Animals were treated as indicated in A. PPLs from control-, metyrapone- (met.), anti-CD3– or metyrapone plus anti-CD3–treated animals were isolated and cultured overnight. IFNγ in the cell-free supernatant was analyzed by ELISA. Bullets indicate values obtained with cells from individual animals (n = 6 per group), horizontal bars indicate mean values, and the asterisk indicates P < 0.05.
Figure 5.
Figure 5.
In situ–produced GCs inhibit the activation of virus-specific intestinal T cells. (A) Schematic overview of the in vivo experiments. TCR tg mice were adrenalectomized to remove the major source of systemic GCs. After 10 d recovery, animals were treated with saline or metyrapone before infection with LCMV. Metyrapone or saline treatment was repeated after 8 and 16 h. 30 h postviral infection, the activation status of intestinal T cells were assessed. (B) Animals were treated as shown in A. IELs, PPLs, and mesentheric lymph node cells (MLNCs) were isolated. CD69 expression on the TCR tg T cells (Vα2+) on CD8αα and CD8αβ subsets (IEL), or CD69 expression on the TCR tg T cells on CD8+ T cells (PPL, MLNC) was monitored by flow cytometry. A typical experiment is shown (n = 3 per group; two experiments). Numbers indicate p-values of the Student's t test. (C) Animals were treated as described in A. IELs, PPLs, and MLNCs from LCMV-infected or LCMV-infected and metyrapone-treated (Met.) were isolated and cultured overnight. IFNγ in the culture supernatant was assessed by ELISA. Numbers indicate p-values.
Figure 6.
Figure 6.
Corticosterone synergistically enhances anti-CD3–induced T cell activation. (A) A1.1 T cells were left untreated or stimulated with anti-CD3 in the presence or absence of corticosterone. Cells were then stained with isotype control (shaded histogram) or anti-CD69 (empty histograms). Fluorescence was analyzed by flow cytometry. (B) A1.1 cells were treated with different concentrations of corticosterone or metyrapone before stimulation with anti-CD3. CD69 expression was assessed by flow cytometry. Mean values of CD69 expression (mean fluorescence intensity [MFI]) of triplicates ± SD are shown. (C) Time course (0–6 h) of CD69 induction in control- or corticosterone-treated and anti-CD3–stimulated cells. Numbers indicate the percentage of positive cells in the gate. (D) A1.1 cells were pretreated with corticosterone (Cort.; 100 nM), RU-486 (1 μM), spironolactone (Spiro; 1 μM) or pregnenolone (Preg.; 1 μM) before stimulation with medium control or anti-CD3 for 6 h. Mean values of CD69 MFI of triplicates ± SD are shown. *P < 0.05; n.s., not significant. All experiments were repeated at least three times.
Figure 6.
Figure 6.
Corticosterone synergistically enhances anti-CD3–induced T cell activation. (A) A1.1 T cells were left untreated or stimulated with anti-CD3 in the presence or absence of corticosterone. Cells were then stained with isotype control (shaded histogram) or anti-CD69 (empty histograms). Fluorescence was analyzed by flow cytometry. (B) A1.1 cells were treated with different concentrations of corticosterone or metyrapone before stimulation with anti-CD3. CD69 expression was assessed by flow cytometry. Mean values of CD69 expression (mean fluorescence intensity [MFI]) of triplicates ± SD are shown. (C) Time course (0–6 h) of CD69 induction in control- or corticosterone-treated and anti-CD3–stimulated cells. Numbers indicate the percentage of positive cells in the gate. (D) A1.1 cells were pretreated with corticosterone (Cort.; 100 nM), RU-486 (1 μM), spironolactone (Spiro; 1 μM) or pregnenolone (Preg.; 1 μM) before stimulation with medium control or anti-CD3 for 6 h. Mean values of CD69 MFI of triplicates ± SD are shown. *P < 0.05; n.s., not significant. All experiments were repeated at least three times.
Figure 7.
Figure 7.
Differential activity of corticosterone on anti-CD3 or peptide-activated T cells. (A) T cells from TCR tg mice were isolated and either stimulated with plate-bound anti-CD3 or gp33 peptide-pulsed irradiated spleen cells (antigen). Corticosterone at different concentrations or the GR antagonist RU486 were added at the beginning of the experiment. After overnight culture, CD69 expression (MFI) on Vα2+ CD8+ cells (TCR tg T cells) was assessed by flow cytometry. Experiments were performed in triplicates. *P < 0.05; **P < 0.005. (B) T cells were activated as described above, and IFNγ production was analyzed after 48 h. *P < 0.05. A typical experiment out of three is shown.

Similar articles

Cited by

References

    1. Powrie, F. 1995. T cells in inflammatory bowel disease: protective and pathogenic roles. Immunity. 3:171–174. - PubMed
    1. Smith, K.M., A.D. Eaton, L.M. Finlayson, and P. Garside. 2000. Oral tolerance. Am. J. Respir. Crit. Care Med. 162:S175–S178. - PubMed
    1. Husband, A.J., K.W. Beagley, and J.R. McGhee. 1999. Mucosal cytokines. Mucosal Immunology. J.R. McGhee, editor. Academic Press, San Diego, CA. 541–557.
    1. Maloy, K.J., and F. Powrie. 2001. Regulatory T cells in the control of immune pathology. Nat. Immunol. 2:816–822. - PubMed
    1. Groux, H., and F. Powrie. 1999. Regulatory T cells and inflammatory bowel disease. Immunol. Today. 20:442–445. - PubMed

Publication types

MeSH terms