

A Leishmania major response locus identified by interval-specific congenic mapping of a T helper type 2 cell bias-controlling quantitative trait locus
- PMID: 15596523
- PMCID: PMC2211989
- DOI: 10.1084/jem.20040334
A Leishmania major response locus identified by interval-specific congenic mapping of a T helper type 2 cell bias-controlling quantitative trait locus
Abstract
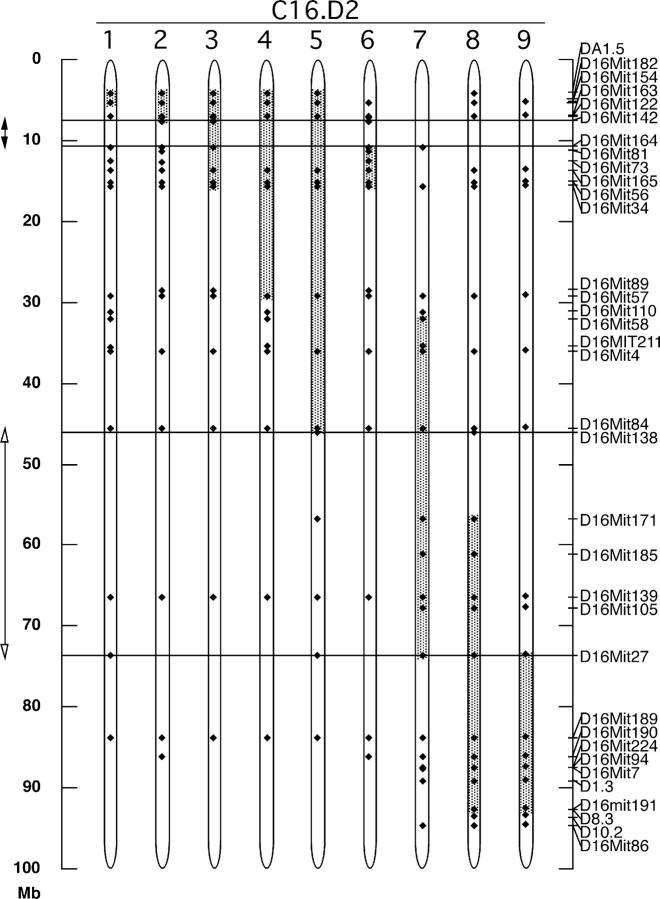
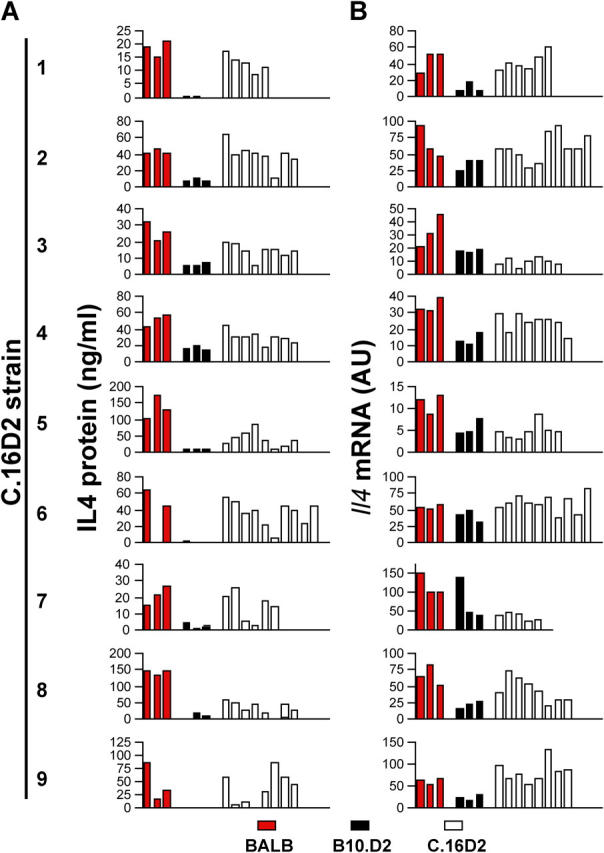
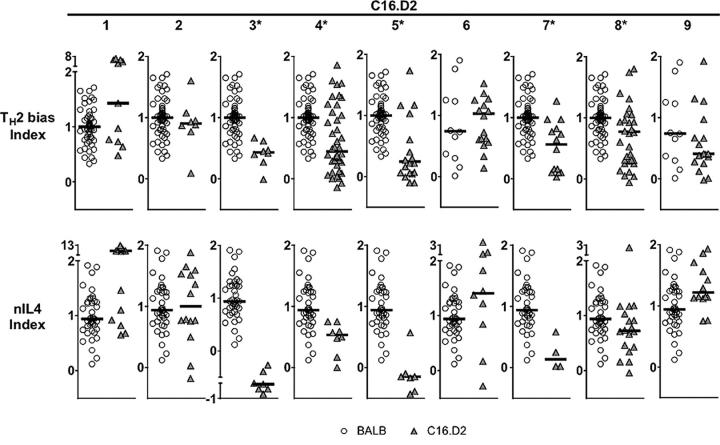
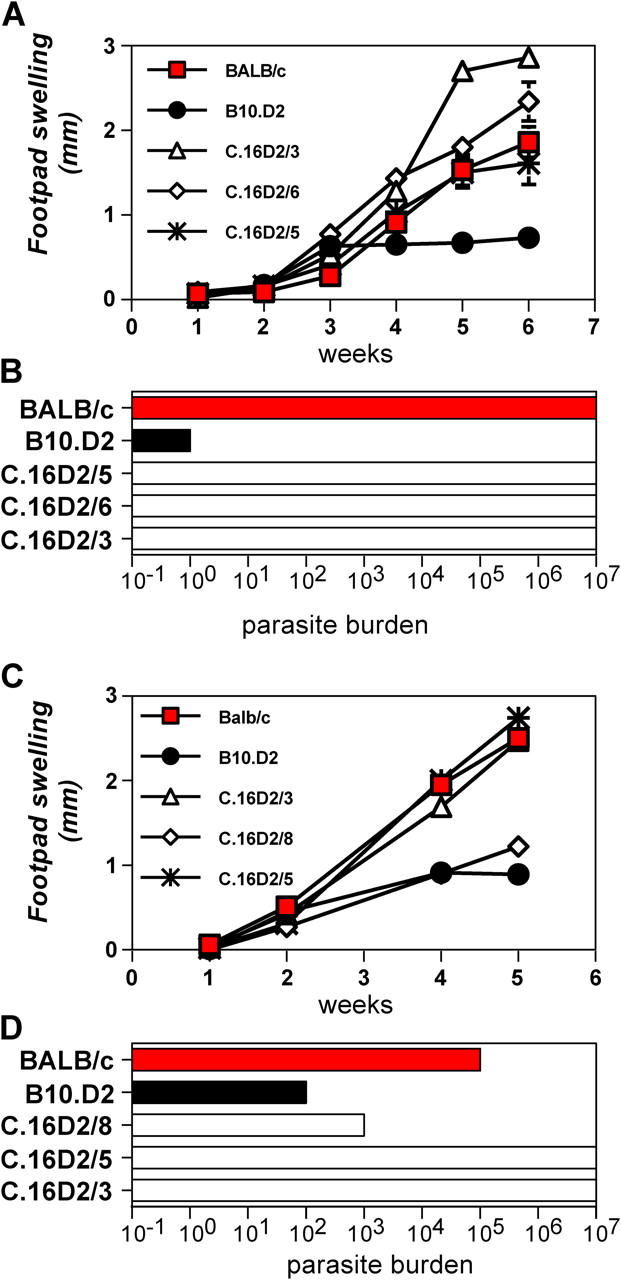
The propensity of naive CD4 T cells to become T helper (Th) type 2 cells correlates with susceptibility to infection by the protozoal parasite Leishmania major. Using genetic linkage analysis, we earlier identified Dice1 as a Th2 cell bias-controlling quantitative trait locus on chromosome 16. Using interval-specific congenic mapping, we now resolve Dice1 into two independent genetic loci, Dice1.1 and Dice1.2, which control Il4 expression from naive Th cells and thereby indirectly control Th2 cell bias. Interestingly, only one of the two congenic intervals containing Dice1.1 and Dice1.2, respectively, also contained an L. major response locus, indicating that L. major responsiveness can be insensitive to determinants that influence Th2 cell bias by controlling naive T cell Il4 expression. These results lay the groundwork for identifying the Dice1.1 and Dice1.2 genes controlling naive T cell Il4 expression and L. major responses, and for testing whether these control other Th2 cell-dependent processes such as worm expulsion, allergic asthma, and dermatitis.
Figures
Similar articles
-
Genetically resistant mice lacking interleukin-12 are susceptible to infection with Leishmania major and mount a polarized Th2 cell response.Eur J Immunol. 1996 Jul;26(7):1553-9. doi: 10.1002/eji.1830260722. Eur J Immunol. 1996. PMID: 8766560
-
New insight into the mechanisms underlying Th2 cell development and susceptibility to Leishmania major in BALB/c mice.Microbes Infect. 1999 Jan;1(1):59-64. doi: 10.1016/s1286-4579(99)80015-x. Microbes Infect. 1999. PMID: 10847767 Review. No abstract available.
-
The mechanism of in vitro T helper cell type 1 to T helper cell type 2 switching in highly polarized Leishmania major-specific T cell populations.J Immunol. 1997 Feb 15;158(4):1559-64. J Immunol. 1997. PMID: 9029090
-
Organ-specific distribution of CD4+ T1/ST2+ Th2 cells in Leishmania major infection.Eur J Immunol. 2002 Sep;32(9):2450-9. doi: 10.1002/1521-4141(200209)32:9<2450::AID-IMMU2450>3.0.CO;2-O. Eur J Immunol. 2002. PMID: 12207329
-
Experimental cutaneous Leishmaniasis: a powerful model to study in vivo the mechanisms underlying genetic differences in Th subset differentiation.Eur J Dermatol. 2002 Jul-Aug;12(4):316-8. Eur J Dermatol. 2002. PMID: 12095873 Review.
Cited by
-
T helper1/t helper2 cells and resistance/susceptibility to leishmania infection: is this paradigm still relevant?Front Immunol. 2012 Apr 17;3:80. doi: 10.3389/fimmu.2012.00080. eCollection 2012. Front Immunol. 2012. PMID: 22566961 Free PMC article.
-
Autoimmunity stimulated by adoptively transferred dendritic cells is initiated by both alphabeta and gammadelta T cells but does not require MyD88 signaling.J Immunol. 2007 Nov 1;179(9):5819-28. doi: 10.4049/jimmunol.179.9.5819. J Immunol. 2007. PMID: 17947655 Free PMC article.
-
Leishmania major degrades murine CXCL1 - An immune evasion strategy.PLoS Negl Trop Dis. 2019 Jul 1;13(7):e0007533. doi: 10.1371/journal.pntd.0007533. eCollection 2019 Jul. PLoS Negl Trop Dis. 2019. PMID: 31260451 Free PMC article.
-
Novel Loci Controlling Parasite Load in Organs of Mice Infected With Leishmania major, Their Interactions and Sex Influence.Front Immunol. 2019 Jun 7;10:1083. doi: 10.3389/fimmu.2019.01083. eCollection 2019. Front Immunol. 2019. PMID: 31231359 Free PMC article.
-
High resolution mapping of trypanosomosis resistance loci Tir2 and Tir3 using F12 advanced intercross lines with major locus Tir1 fixed for the susceptible allele.BMC Genomics. 2010 Jun 22;11:394. doi: 10.1186/1471-2164-11-394. BMC Genomics. 2010. PMID: 20569426 Free PMC article.
References
-
- Reiner, S., and R. Locksley. 1995. The regulation of immunity to Leishmania Major In Annual Review of Immunology. W.E. Paul, editor. Annual Reviews Inc., Palo Alto. 151–177. - PubMed
-
- Finkelman, F.D., and J.F. Urban Jr. 2001. The other side of the coin: the protective role of the TH2 cytokines. J. Allergy Clin. Immunol. 107:772–780. - PubMed
-
- Kaplan, M.H., and M.J. Grusby. 1998. Regulation of T helper cell differentiation by STAT molecules. J. Leukoc. Biol. 64:2–5. - PubMed
Publication types
MeSH terms
Substances
Grants and funding
LinkOut - more resources
Full Text Sources
Molecular Biology Databases
Research Materials
