. 2004 Dec 20;167(6):1183-94.
doi: 10.1083/jcb.200403043. Epub 2004 Dec 13.

Force measurements in E-cadherin-mediated cell doublets reveal rapid adhesion strengthened by actin cytoskeleton remodeling through Rac and Cdc42

Affiliations

Force measurements in E-cadherin-mediated cell doublets reveal rapid adhesion strengthened by actin cytoskeleton remodeling through Rac and Cdc42

Yeh-Shiu Chu et al. J Cell Biol. .

Abstract

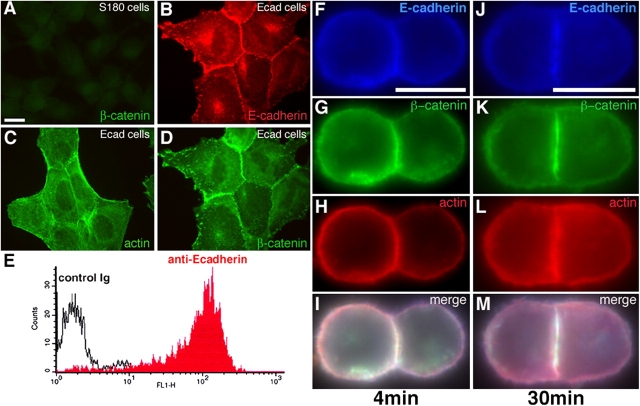
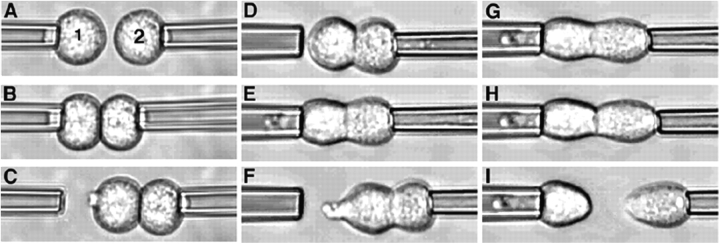
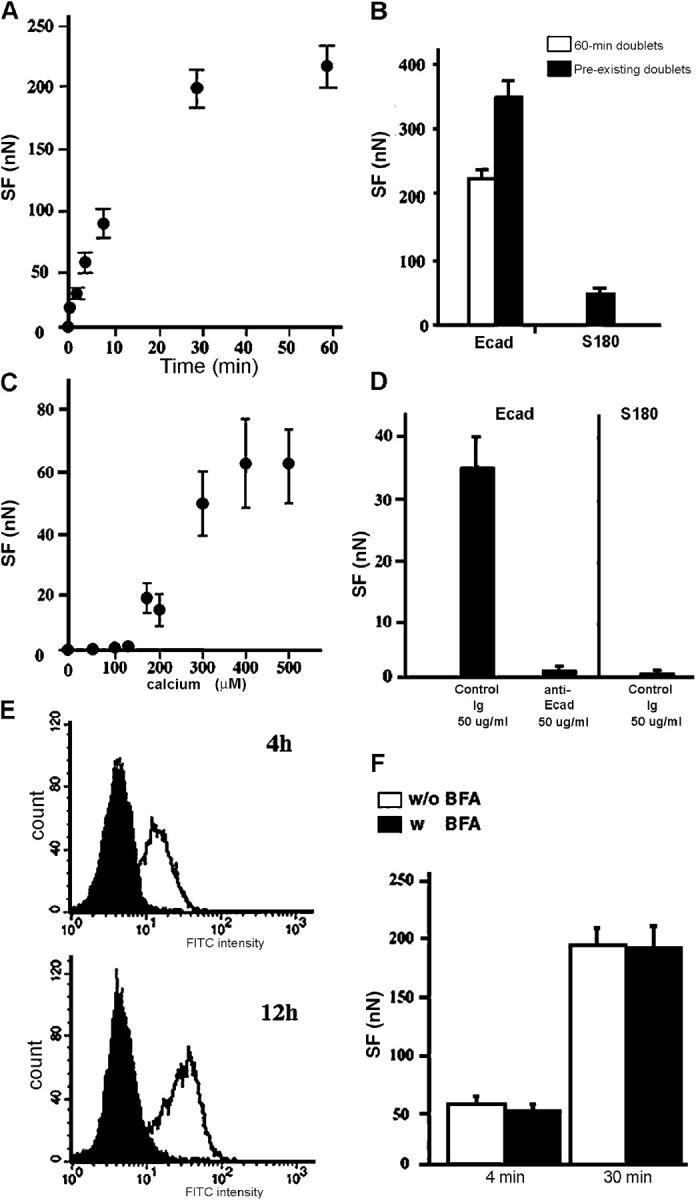
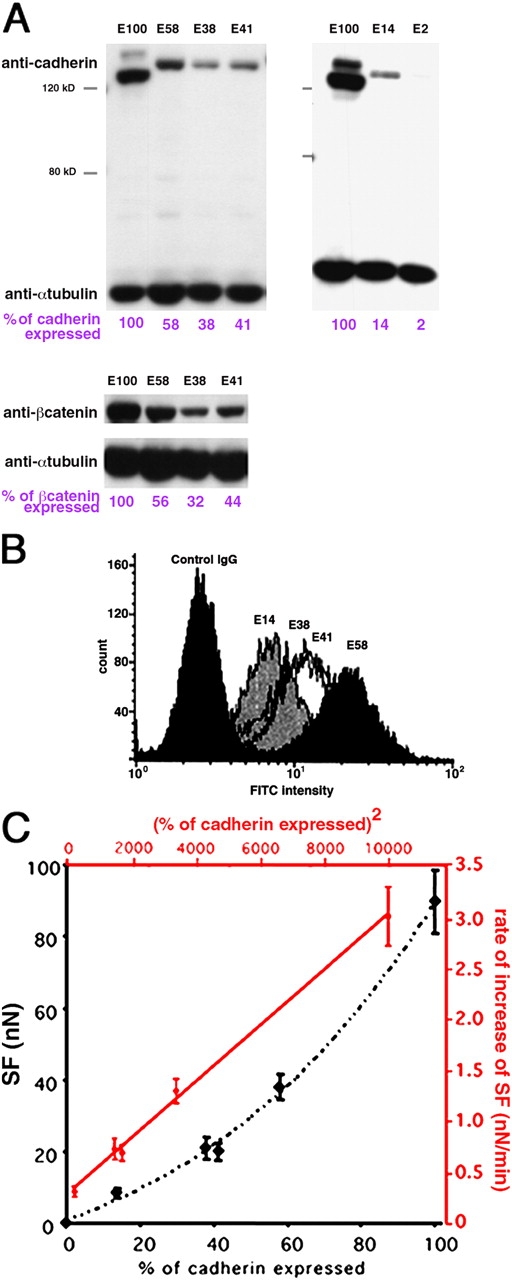
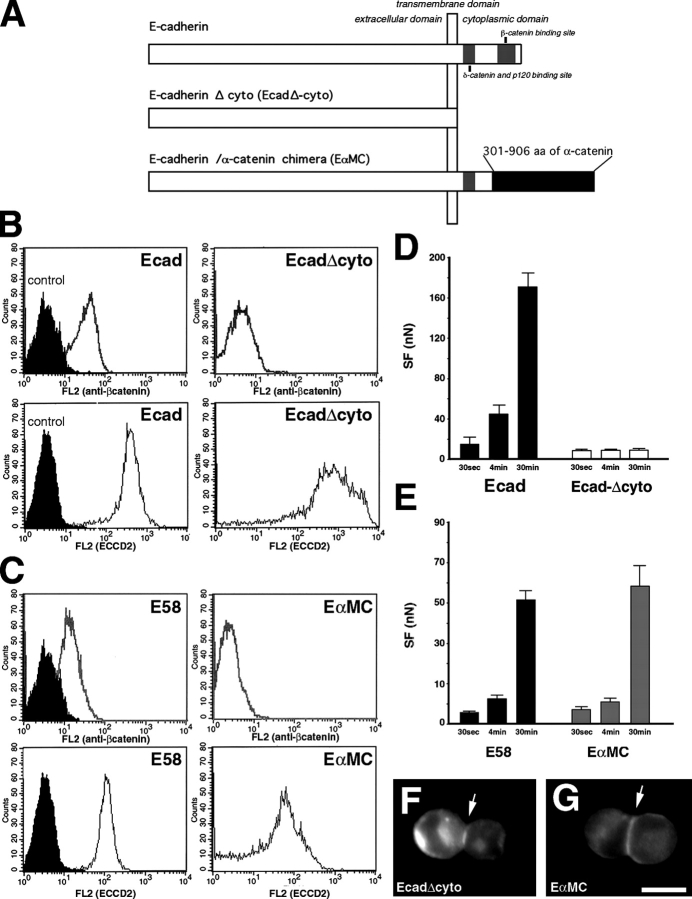
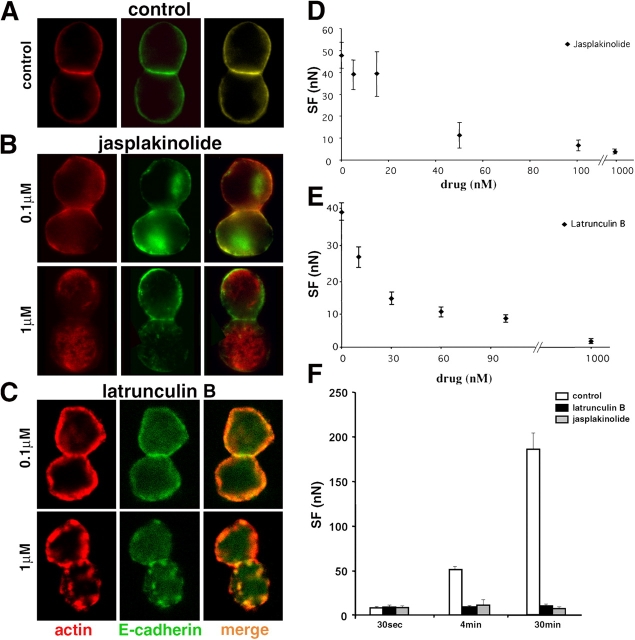
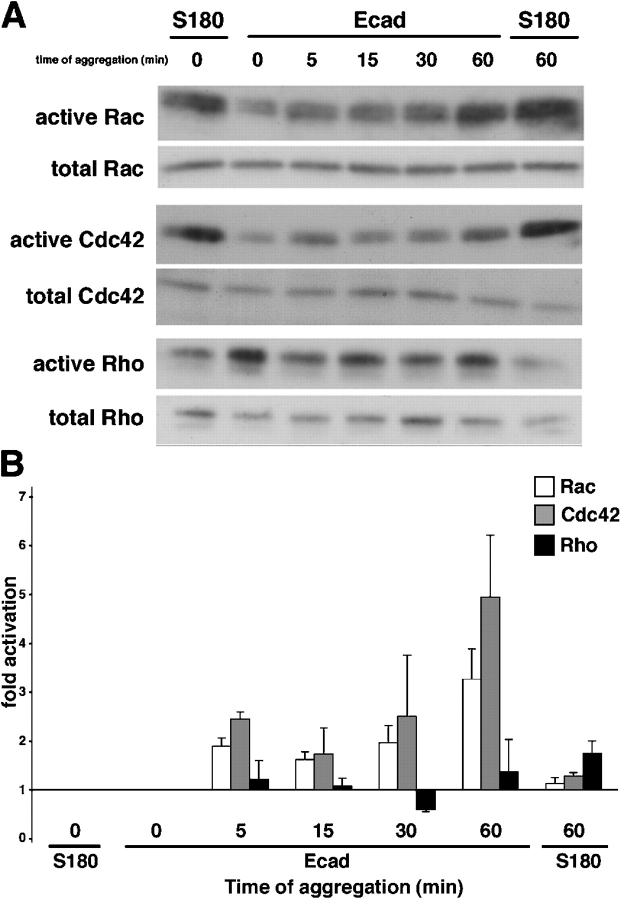
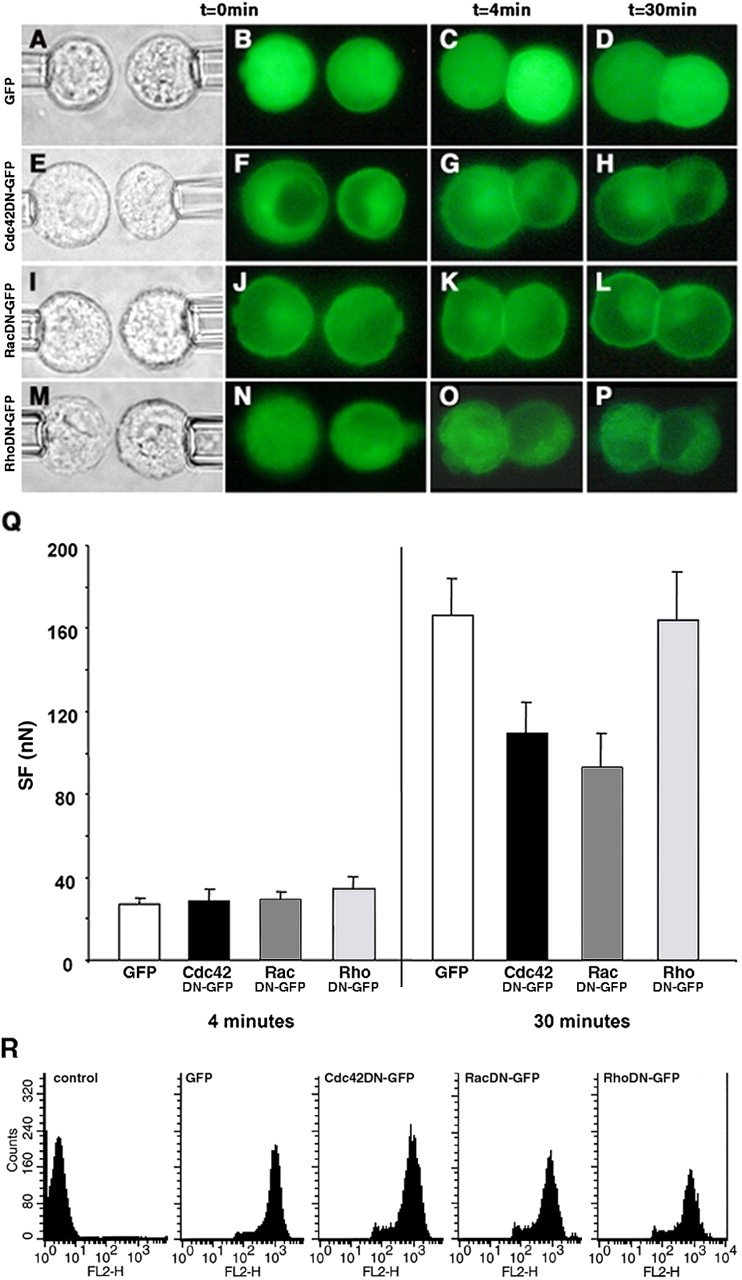
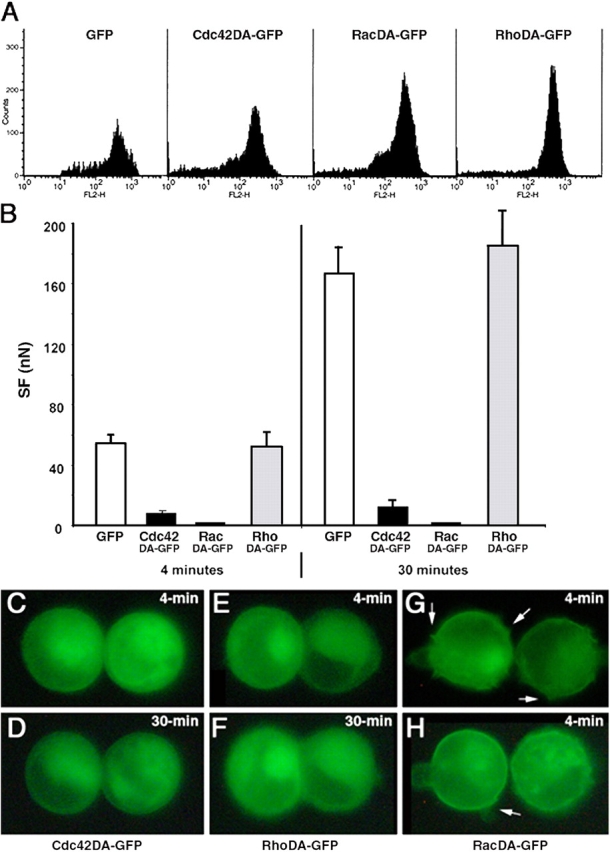
We have used a modified, dual pipette assay to quantify the strength of cadherin-dependent cell-cell adhesion. The force required to separate E-cadherin-expressing paired cells in suspension was measured as an index of intercellular adhesion. Separation force depended on the homophilic interaction of functional cadherins at the cell surface, increasing with the duration of contact and with cadherin levels. Severing the link between cadherin and the actin cytoskeleton or disrupting actin polymerization did not affect initiation of cadherin-mediated adhesion, but prevented it from developing and becoming stronger over time. Rac and Cdc42, the Rho-like small GTPases, were activated when E-cadherin-expressing cells formed aggregates in suspension. Overproduction of the dominant negative form of Rac or Cdc42 permitted initial E-cadherin-based adhesion but affected its later development; the dominant active forms prevented cell adhesion outright. Our findings highlight the crucial roles played by Rac, Cdc42, and actin cytoskeleton dynamics in the development and regulation of strong cell adhesion, defined in terms of mechanical forces.


Figures

Figure 1.
Figure 1.
Adhesive properties of Ecad cells. Immunodetection of β-cat (A and D), E-cadherin (B), and actin (C) in S180 cells (A) and Ecad cells (B–D). E, FACS analysis on isolated Ecad cells in suspension, after TC treatment, with an antibody directed against the extracellular domain of E-cadherin. Immunodetection of E-cadherin (F and J), β-cat (G and K), and actin (H and L) in doublets formed in suspension for 4- (F–I) or 30-min (J–M). Merged images are shown in I and M. Bars: (A) 20 μm; (F and J) 10 μm.
Figure 2.
Figure 2.
Dual micropipette assay. (A) Two cells in suspension (1 and 2) are held under weak aspiration by micropipettes, and placed in contact (B; Video 1). The formation of contact is checked (C) after displacement of the right pipette. (D) Second cell is held by the micropipette under strong aspiration. (E–I) First cell is held by the micropipette and the aspiration applied is increased as the right micropipette displaced, step by step, until the adherent cells are separated (I; Video 2).
Figure 3.
Figure 3.
Characterization of Ecad cell adhesion. (A) SF measurements for Ecad cells held in contact for 0.5–60 min. (B) SF required to separate 60-min doublets (white bar) and preexisting doublets (black bars), selected as described in Materials and methods. (C) Dose-response curve of force measurements for 4-min doublets in various concentrations of calcium. (D) The effect of a control or anti–E-cadherin antibody on SF in Ecad or S180 cells. (E) FACS analysis of E-cadherin expression on the surface of Ecad cells treated with 10 μM BFA (black peaks) for 4 and 12 h or untreated (white peaks). (F) The mean SFs measured for 4- or 30-min Ecad doublets treated with 10 μM BFA (black bars) for 1 h or untreated doublets (white bars).
Figure 4.
Figure 4.
SF depends on cadherin expression at the surface. (A and B) Characterization of clones differing in E-cadherin expression level. (A) Western blot analysis of cell extracts with anti–E-cadherin or β-cat, paired with an anti–α-tubulin. Quantification of cadherin and β-cat in cell extracts is indicated in violet. (B) FACS analysis of E-cadherin expression on the cell surface of four different clones. (C) SF (y axis, nN) measured for 30-min doublets of various clones (x axis, relative cadherin content in %). In red, the rate of increase of SF (y axis, nN/min) varies linearly with the square of the % cadherin expression (x axis). The equation for the best fitting red line is Y = 3 × 10⁻⁴ X + 0.2661.
Figure 5.
Figure 5.
The time-dependent increase in SF depends on the connection of cadherin to the actin cytoskeleton. (A) Schematic representation of the structure of wild-type cadherin, E-cadherin lacking the cytoplasmic domain (Ecad-Δcyto), and E-cadherin–α-cat chimera (EαMC) expressed by transiently transfected S180 cells. FACS analysis of transiently cotransfected cells expressing Ecad (B), Ecad-Δcyto (B), EαMC (C), or E58 cells (C) with anti–β-cat (B and C, top, white peaks), anti–E-cadherin ECCD2 antibody (B and C, bottom, white peaks), or control antibodies (black peaks). (D and E) Mean SF for 30-s, 4- and 30-min doublets of GFP-positive cells expressing E-cadherin (D, black bars), Ecad-Δcyto (D, white bars), EαMC chimera (E, gray bars), and doublets of E58 cells (E, black bars). Immunodetection of Ecad-Δcyto (F) and EαMC (G) proteins in representative doublets formed after 30-min aggregation in suspension. Bar, 10 μm.
Figure 6.
Figure 6.
Drugs affecting actin polymerization perturb actin cytoskeleton organization and decrease SF. Confocal analysis of Ecad doublets formed in suspension under control conditions (A), in the presence of Jasp (B) or LatB (C), and labeled for actin and E-cadherin. Merged images are shown in right panels. The images correspond to a medial transverse plane of the doublet. Dose-response curve of SF for 4-min Ecad doublets in medium containing Jasp (D) or LatB (E). (F) Mean SF for 30-s, 4- and 30-min doublets in the presence of 0.1 μM LatB (black bars), 0.1 μM Jasp (gray bars), or in control medium (white bars).
Figure 7.
Figure 7.
Activation of small GTPases during Ecad cell aggregation. Representative Western blot analysis of GTP-bound (active) and total Rac, Cdc42, and Rho on S180 and Ecad cells taken at different times of the aggregation assay in suspension (A). (B) Fold activation of the Rac (white bars), Cdc42 (gray bars) and Rho (black bars) GTPases; the activation level at time 0 serves as the reference level. Activation fold represents the mean ± SEM from three independent experiments.
Figure 8.
Figure 8.
The effect of dominant negative GTPase protein expression on SF. Distribution of GFP-tagged proteins in transfected Ecad cells producing GFP (B–D), and the Cdc42DN (F–H), RacDN (J–L), and RhoDN (N–P) before contact (B, F, J, and N), in 4-min doublets (C, G, K, and O) and in 30-min doublets (D, H, L, and P). Each row represents a series of real-time images of a doublet monitored by light transmission or epifluorescence microscopy before and at 4 and 30 min of contact. Q, SF measured for 4- and 30-min Ecad doublets producing either GFP (white bars), Cdc42DN (black bars), RacDN (dark gray bars), or RhoDN (light gray bars). (R) FACS analysis of transiently transfected Ecad cells, positive for GFP, Cdc42DN, RacDN, or RhoDN, and immunostained with an antibody directed against the extracellular domain of E-cadherin (FL2 channel).
Figure 9.
Figure 9.
The effect of dominant active GTPase protein expression on SF. (A) FACS analysis of transiently transfected Ecad cells, positive for GFP, Cdc42DA, RacDA or RhoDA, and immunostained with an antibody directed against the extracellular domain of E-cadherin (FL2 channel). (B) SF measured for 4- and 30-min Ecad doublets producing GFP (white bars), Cdc42DA (black bars), RacDA (dark gray bars) and RhoDA (light gray bars). Real-time images showing the distribution of GFP-tagged proteins in 4-min (C, E, G, and H) and 30-min (D and F) doublets of Ecad cells producing Cdc42DA (C and D), RhoDA (E and F), or RacDA (G and H). Arrows in G and H indicate the membrane protrusions specifically observed in RacDA transfectants.

References

    1. Adams, C.L., W.J. Nelson, and S.J. Smith. 1996. Quantitative analysis of cadherin-catenin-actin reorganization during development of cell–cell adhesion. J. Cell Biol. 135:1899–1911. - PMC - PubMed
    1. Angres, B., A. Barth, and W.J. Nelson. 1996. Mechanism for transition from initial to stable cell–cell adhesion: kinetic analysis of E-cadherin–mediated adhesion using a quantitative adhesion assay. J. Cell Biol. 134:549–557. - PMC - PubMed
    1. Arthur, W.T., and K. Burridge. 2001. RhoA inactivation by p190RhoGAP regulates cell spreading and migration by promoting membrane protrusion and polarity. Mol. Biol. Cell. 12:2711–2720. - PMC - PubMed
    1. Baumgartner, W., P. Hinterdorfer, W. Ness, A. Raab, D. Vestweber, H. Schindler, and D. Drenckhahn. 2000. Cadherin interaction probed by atomic force microscopy. Proc. Natl. Acad. Sci. USA. 97:4005–4010. - PMC - PubMed
    1. Beauvais, A., C.A. Erickson, T. Goins, S.E. Craig, M.J. Humphries, J.P. Thiery, and S. Dufour. 1995. Changes in the fibronectin-specific integrin expression pattern modify the migratory behaviour in the embryonic environment. J. Cell Biol. 128:699–713. - PMC - PubMed

Publication types