. 2004 Dec 20;167(6):1063-74.
doi: 10.1083/jcb.200408172. Epub 2004 Dec 13.

Nuclear translocation of an ICA512 cytosolic fragment couples granule exocytosis and insulin expression in {beta}-cells

Affiliations

Nuclear translocation of an ICA512 cytosolic fragment couples granule exocytosis and insulin expression in {beta}-cells

Mirko Trajkovski et al. J Cell Biol. .

Abstract

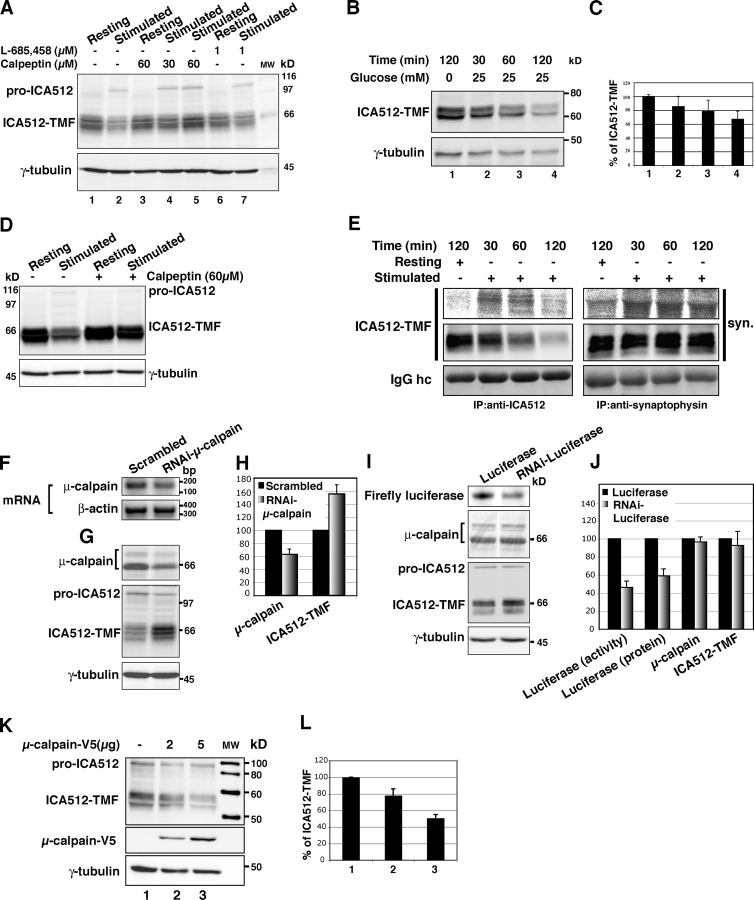
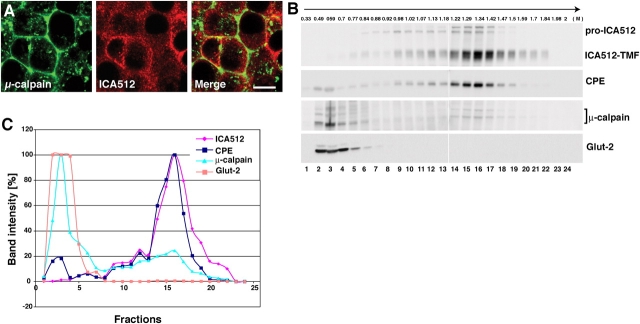
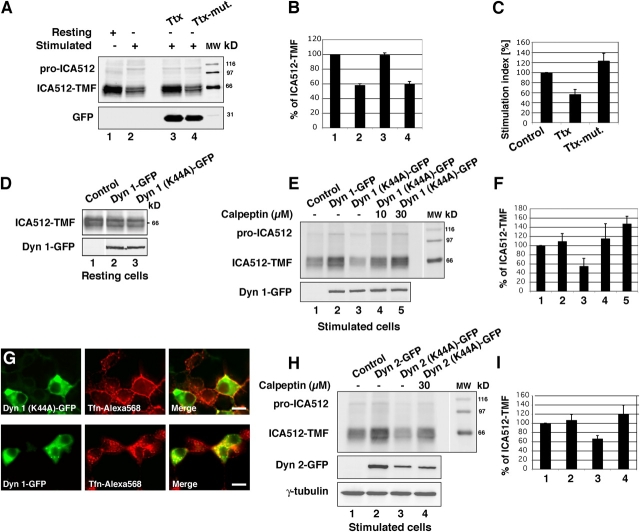
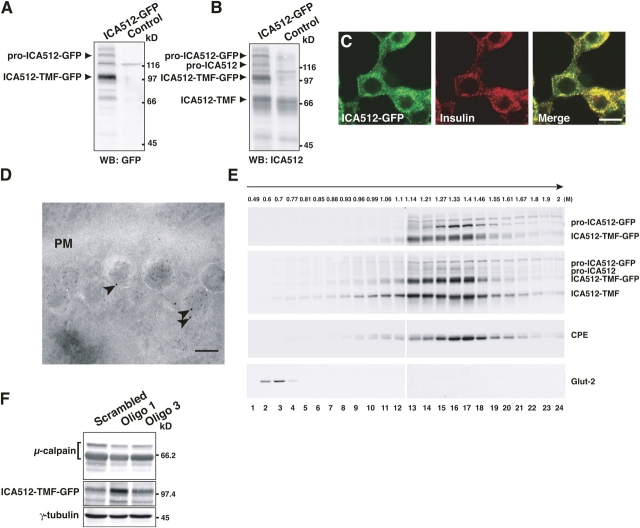
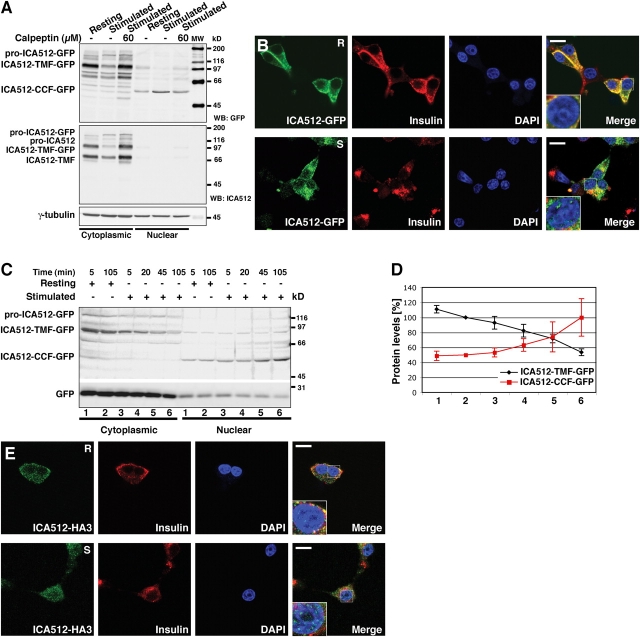
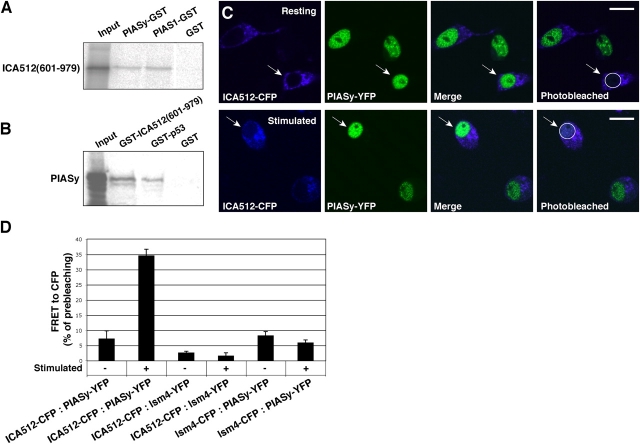
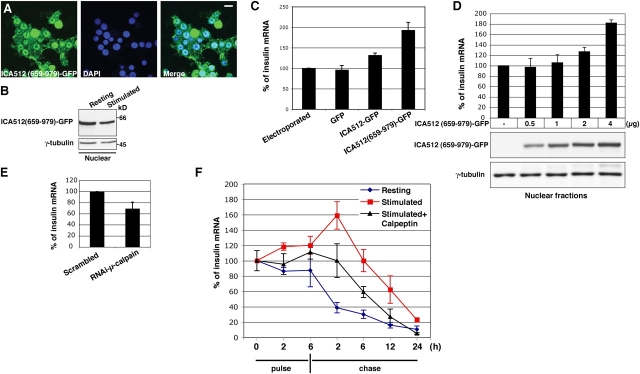
Islet cell autoantigen 512 (ICA512)/IA-2 is a receptor tyrosine phosphatase-like protein associated with the insulin secretory granules (SGs) of pancreatic beta-cells. Here, we show that exocytosis of SGs and insertion of ICA512 in the plasma membrane promotes the Ca(2+)-dependent cleavage of ICA512 cytoplasmic domain by mu-calpain. This cleavage occurs at the plasma membrane and generates an ICA512 cytosolic fragment that is targeted to the nucleus, where it binds the E3-SUMO ligase protein inhibitor of activated signal transducer and activator of transcription-y (PIASy) and up-regulates insulin expression. Accordingly, this novel pathway directly links regulated exocytosis of SGs and control of gene expression in beta-cells, whose impaired insulin production and secretion causes diabetes.


Figures

Figure 1.
Figure 1.
ICA512 cytoplasmic domain is cleaved by μ-calpain in response to stimulation of β-cells. (A) Western blot for ICA512 (top) and γ-tubulin (bottom) on 40 μg of protein from INS-1 cells that had been incubated with resting or stimulating buffer for 105 min following 1 h at rest. Protease inhibitors L-685,458 and calpeptin were added at indicated concentrations. (B) Western blots for ICA512 (top) and γ-tubulin (bottom) on 30 μg of protein from rat islets that were incubated with 0 (resting) or 25 mM (stimulated) glucose for indicated times. (C) Quantitation of ICA512-TMF from two independent experiments as shown in B. (D) Western blots for ICA512 (top) and γ-tubulin (bottom) on 30 μg of protein from rat islets that were incubated in resting or stimulating buffers as in A, with or without 60 μM calpeptin. White lines indicate that intervening lanes have beem spliced out. (E) Autoradiographies showing the turnover of newly synthesized ICA512-TMF (top left) and synaptophysin (syn.; top right) as determined by pulse-chase and immunoprecipitation from [35S]methionine-labeled INS-1 cells kept at rest or stimulated for the indicated times. Middle and bottom panels show the total amount of ICA512-TMF (left middle), synaptophysin (right middle), and IgG heavy chain (bottom panels) in each immunoprecipitate as visualized by Western blotting. (F) Levels of μ-calpain and β-actin mRNAs by semiquantitative RT-PCR in INS-1 cells transfected with scrambled or anti–μ-calpain siRNA oligos 1. (G) Western blots for μ-calpain (top), ICA512 (middle), and γ-tubulin (bottom) on 40 μg of protein from stimulated INS-1 cells transfected with scrambled or anti–μ-calpain siRNA oligos 1. (H) Quantitation of μ-calpain and ICA512-TMF from three independent experiments as shown in G. (I) Western blots for firefly luciferase (top), μ-calpain (middle top), ICA512-TMF (middle bottom), and γ-tubulin (bottom) on 30 μg of protein in INS-1 cells transfected with firefly luciferase cDNA and untreated or treated with siRNA oligos for firefly luciferase. White lines indicate that intervening lanes have beem spliced out. (J) Firefly luciferase activity and protein levels of firefly luciferase, μ-calpain, and ICA512-TMF from three independent experiments as shown in I. (K) Western blots for ICA512 (top), μ-calpain-V5 (middle), and γ-tubulin (bottom) on 40 μg of protein from INS-1 cells transfected with the indicated amount of cDNA for μ-calpain-V5 and stimulated as in A. (L) Quantitation of ICA512-TMF from three independent experiments as shown in K. In B, D, H, J, and L, protein signals were normalized for γ-tubulin and expressed as a percentage of their respective values in cells at rest (B and D), transfected with scrambled siRNA oligos (H) or firefly luciferase cDNA (J), or electroporated (L). Error bars in C, H, J, and L show mean + SD.
Figure 2.
Figure 2.
μ-Calpain is enriched at the plasma membrane. (A) Confocal microscopy of INS-1 cells double immunostained with anti–μ-calpain (pseudogreen) and anti-ICA512ecto (pseudored) antibodies. Bar, 10 μm. (B) Western blots with anti–μ-calpain, anti-ICA512, anti-CPE, and anti-Glut2 antibodies on INS-1 cell fractions separated on a continuous sucrose density gradient. The sucrose molarity of each fraction is indicated on the top. (C) Protein distribution in the fractions shown in B. The highest signal for each protein was equaled to 100%.
Figure 3.
Figure 3.
ICA512 is cleaved by μ-calpain at the plasma membrane. (A) Western blottings with anti-ICA512 (top) or GFP (bottom) antibodies on 40 μg of protein from INS-1 cells cotransfected with active (Ttx) or inactive (Ttx-mut.) tetanus toxin light chain and GFP. Cells were incubated in resting or stimulating buffer for 105 min after 1 h at rest. (B) Quantitation of ICA512-TMF from three independent experiments as shown in A. (C) Stimulation index of insulin secretion from INS-1 cells that were either nontransfected or transfected with Ttx or Ttx-mut. (D) Western blotting with anti-ICA512 (top) and anti-GFP (bottom) antibodies on 30 μg of protein from INS-1 cells, which were either nontransfected (control) or transiently transfected with dynamin 1-GFP or dynamin 1 (K44A)-GFP and kept in resting buffer for 1 h. White lines indicate that intervening lanes have been spliced out. (E and H) Western blotting with anti-ICA512 (top) and anti-GFP (bottom) antibodies on 20 μg of protein from INS-1 cells, which were either nontransfected (control) or transiently transfected dynamin 1-GFP or dynamin 1 (K44A)-GFP (E) and with dynamin 2-GFP or dynamin 1 (K44A)-GFP (H). Cells were stimulated for 105 min in the absence or presence of calpeptin at the indicated concentration. As the expression of dynamin 2 constructs differed, loading of comparable protein amount was verified by immunoblot for γ-tubulin. (F and I) Quantitation of ICA512-TMF from four independent experiments as shown in E and H, respectively. Error bars in B, C, F, and I show mean + SD. (G) Fluorescence microscopy on INS-1 cells transiently transfected with dynamin 1 (K44A)-GFP (top) or dynamin 1-GFP (bottom) and incubated with Alexa568-transferrin (Tfn-Alexa568). Bars, 10 μm.
Figure 4.
Figure 4.
ICA512-GFP is correctly processed and targeted to SGs. (A and B) Western blottings with anti-GFP (A) or anti-ICA512 (B) antibodies on 40 μg of protein from INS-1 cells nontransfected (control) or stably transfected with ICA512-GFP. (C) Confocal microscopy on INS-1 ICA512-GFP cells immunostained for insulin (pseudored). Bar, 10 μm. (D) Immunoelectron microscopy on resting INS-1 ICA512-GFP cells double labeled with anti-insulin (6 nm of gold) and anti-GFP (12 nm of gold; arrowheads) antibodies. PM, plasma membrane. Bar, 200 nm. (E) Western blottings with anti-GFP, anti-ICA512, anti-CPE, and anti-Glut2 antibodies on fractions of INS-1 ICA512-GFP cells separated on a continuous sucrose density gradient. The sucrose molarity of each fraction is indicated on the top. (F) Western blots for μ-calpain (top), ICA512 (middle), and γ-tubulin (bottom) on 40 μg of protein from INS-1 cells transfected with scrambled or anti–μ-calpain siRNA oligos 1 or 3.
Figure 5.
Figure 5.
ICA512-CCF is translocated to the nucleus upon stimulation. (A) Western blots with anti-GFP (top), anti-ICA512 (middle), and γ-tubulin (bottom) on 50 μg of cytoplasmic and 25 μg of nuclear protein from INS-1 ICA512-GFP cells. Cells were incubated with resting or stimulating buffer for 105 min after 1 h at rest and with or without 60 μM calpeptin. (B) 0.5-μm optical Z-sections of INS-1 ICA512-GFP cells kept at rest (R; top) or stimulated (S; bottom) as in A and immunolabeled with anti-insulin antibody (pseudored). ICA512-GFP is shown as pseudogreen, whereas nuclei were counterstained with DAPI (pseudoblue). Insets in the right panels show high magnifications of the marked areas. (C) Western blots with anti-GFP on 40 μg of cytoplasmic and 20 μg of nuclear protein from INS-1 ICA512-GFP cells incubated as in A for the indicated times. (D) Quantitation of ICA512-TMF-GFP and ICA512-CCF-GFP in cytoplasmic (black line) and nuclear (red line) extracts at the indicated time points 1–6. Values are from four independent experiments as shown in C. For graphic representation, the amounts of ICA512-TMF-GFP and ICA512-CCF-GFP after 105 min in resting buffer (time point 2) were equaled to 100% and 50%, respectively. Error bars show mean ± SD. (E) 0.5-μm optical Z-sections of INS-1 cells transiently transfected with ICA512-HA, kept at rest (R; top) or stimulated (S; bottom) as in A, and immunolabeled with rabbit anti-HA (pseudogreen) and mouse anti-insulin (pseudored) antibodies. Nuclei were counterstained with DAPI (pseudoblue). Insets in the right panels show high magnifications of the marked areas. Bars, 10 μm.
Figure 6.
Figure 6.
ICA512-CCF binds PIASy in the nucleus. (A) SDS-PAGE and autoradiography of in vitro transcribed and translated [35S]methionine-labeled ICA512(601–979) pulled down with glutathione sepharose beads coupled to 0.5 μg PIASy-GST, PIAS1-GST, or GST alone. Lane 1 shows the starting labeled material for the pull-down assay. White lines indicate that intervening lanes have been spliced out. (B) SDS-PAGE and autoradiography of in vitro transcribed and translated [35S]methionine-labeled PIASy pulled down with glutathione sepharose beads coupled to 0.5 μg GST-ICA512(601–979), GST-p53, or GST alone. First lane shows the starting labeled material for the pull-down assay. (C) FRET between ICA512-CFP (pseudocyan) and PIASγ-YFP (pseudogreen) in transiently cotransfected INS-1 cells incubated in resting or stimulating buffer for 105 min after 1 h at rest. The right panels show the signal for ICA512-CFP following the photobleaching of PIASy-YFP in the circled nuclei (arrows). (D) Quantitation of FRET to CFP in INS-1 cells transiently cotransfected with the indicated constructs: ICA512-CFP + PIASy-YFP; ICA512-CFP + lsm4-YFP; lsm4-CFP + PIASy-YFP. Values are from two independent experiments as shown in C. (D) Error bars show mean + SD.
Figure 7.
Figure 7.
ICA512-CCF promotes insulin gene expression. (A) Confocal microscopy on INS-1 cells transiently transfected with ICA512 (659–979)-GFP and counterstained with DAPI. Bar, 10 μm. (B) Western blot with goat anti-GFP (top) and anti–γ-tubulin (bottom) antibodies on 6 μg of nuclear protein from INS-1 cells transiently transfected with ICA512(659–979)-GFP and incubated with resting or stimulating buffer for 105 min after 1 h at rest. (C) Insulin mRNA levels quantified by real-time PCR in INS-1 cells that were either electroporated only or transfected with 4 μg of vector encoding GFP, ICA512-GFP, or ICA512(659–979)-GFP and kept at rest for 1 h. The results are from three independent experiments, each in triplicate. (D) Insulin mRNA levels quantified by real-time PCR in INS-1 cells which were either electroporated only or transfected with 0.5–4 μg ICA512(659–979)-GFP and collected after 4 d in culture with 11 mM glucose. The results are from four independent experiments, each in triplicate. In C and D, the levels of insulin mRNA in electroporated cells were equaled to 100%. In D, ICA512(659–979)-GFP and γ-tubulin levels were assessed by Western blotting with goat anti-GFP (middle) and anti-γ-tubulin (bottom) antibodies. (E) Insulin mRNA levels quantified by real-time PCR in INS-1 cells transfected either with scrambled or anti–μ-calpain siRNA oligos 1 + 2. The results are from three independent experiments, each in triplicate. The level of insulin mRNA in cells transfected with the scrambled oligos was equaled to 100%. Error bars (C, D, and E) show mean + SD. (F) Insulin mRNA levels quantified by real-time PCR in INS-1 cells that were at rest (2.8 mM glucose and 5 mM KCl) for 1 h, then in resting or stimulating buffer, with or without 40 μM calpeptin, for up to 6 h (pulse), and finally in resting buffer for up to 24 h (chase). Total RNA was collected at 0-, 2-, and 6-h time points of the pulse and then at 2-, 6-, 12-, and 24-h time points of the chase. The results are from three independent experiments, each in triplicate. The level of insulin mRNA in resting INS-1 cells was equaled to 100%. Error bars show mean ± SD.

Similar articles

Cited by

References

    1. Asfari, M., D. Janjic, P. Meda, G. Li, P.A. Halban, and C.B. Wollheim. 1992. Establishment of 2-mercaptoethanol-dependent differentiated insulin-secreting cell lines. Endocrinology. 130:167–178. - PubMed
    1. Biederer, T., X. Cao, T.C. Sudhof, and X. Liu. 2002. Regulation of APP-dependent transcription complexes by Mint/X11s: differential functions of Mint isoforms. J. Neurosci. 22:7340–7351. - PMC - PubMed
    1. Billestrup, N., P. Bouchelouche, G. Allevato, M. Ilondo, and J.H. Nielsen. 1995. Growth hormone receptor C-terminal domains required for growth hormone-induced intracellular free Ca2+ oscillations and gene transcription. Proc. Natl. Acad. Sci. USA. 92:2725–2729. - PMC - PubMed
    1. Borg, J.P., S.W. Straight, S.M. Kaech, M. de Taddeo-Borg, D.E. Kroon, D. Karnak, R.S. Turner, S.K. Kim, and B. Margolis. 1998. Identification of an evolutionarily conserved heterotrimeric protein complex involved in protein targeting. J. Biol. Chem. 273:31633–31636. - PubMed
    1. Chen, C.Z., L. Li, H.F. Lodish, and D.P. Bartel. 2004. MicroRNAs modulate hematopoietic lineage differentiation. Science. 303:83–86. - PubMed

Publication types

MeSH terms