

Patients' perceptions of the value of current vision: assessment of preference values among patients with subfoveal choroidal neovascularization--The Submacular Surgery Trials Vision Preference Value Scale: SST Report No. 6
- PMID: 15596591
- PMCID: PMC1256026
- DOI: 10.1001/archopht.122.12.1856
Patients' perceptions of the value of current vision: assessment of preference values among patients with subfoveal choroidal neovascularization--The Submacular Surgery Trials Vision Preference Value Scale: SST Report No. 6
Abstract
Objective: To improve understanding and awareness of the impact of subfoveal choroidal neovascularization (CNV) on health-related quality of life, we sought to measure the preference value that patients with subfoveal CNV assigned to their health and vision status.
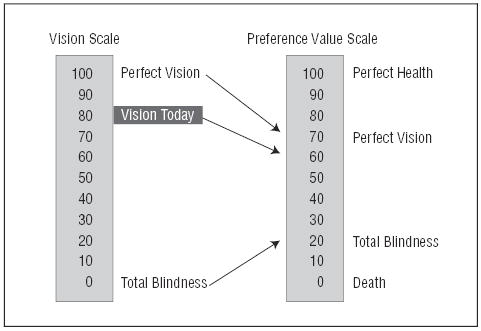
Patients and methods: Patients with subfoveal CNV completed telephone interviews about their quality of life prior to enrollment and random treatment assignment in the Submacular Surgery Trials, a set of multicenter randomized controlled trials evaluating outcomes of submacular surgery compared with observation. The interviewers asked patients to rate their current vision on a scale from 0 (completely blind) to 100 (perfect vision). The interviewers also asked them to rate complete blindness and then perfect vision, assuming their health otherwise was the same as it was at the time of the interview, on a scale from 0 (dead) to 100 (perfect health with perfect vision). Scores were converted to a 0 to 1 preference value scale for health and vision status, where 0 represents death and 1 represents perfect health and vision.
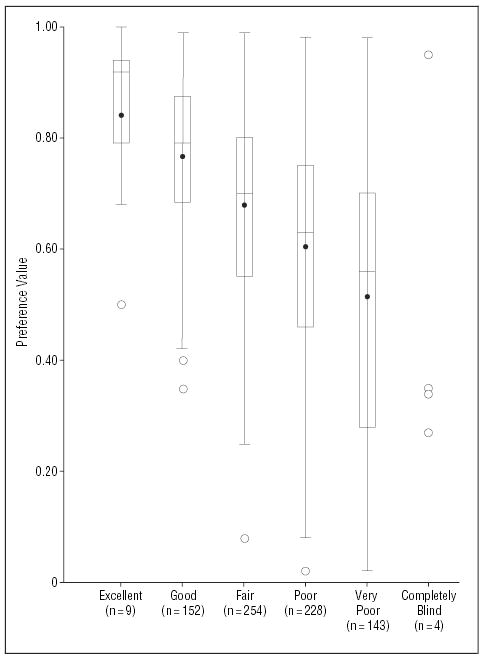
Results: Of 1015 participants enrolled in the Submacular Surgery Trials, 996 completed interviews that included the rating questions, and 792 (80%) answered all 3 rating questions in a manner permitting calculation of a single overall preference value for their current health and vision status on a scale from 0 (dead) to 1 (perfect). The mean preference value was 0.64 (median, 0.68; interquartile range, 0.51-0.80). The preference values correlated with age (Pearson correlation coefficient, -0.11; P = .002), patients' self-rated perception of overall health (Spearman correlation coefficient, 0.36; P<.001), and self-reported perception of vision (Spearman correlation coefficient, 0.47; P<.001). The preference values were significantly lower with poorer visual acuity in the better eye and greater evidence of dysfunction on either the Hospital Anxiety and Depression Scale or the Physical or Mental Component Summary scales of the Short Form-36 Health Survey but did not differ significantly by gender or other baseline characteristics such as race, treatment assignment, or size of the CNV lesion.
Conclusions: Vision loss from subfoveal CNV is associated with patient preference values that are as low as or lower than values previously reported for other serious medical conditions such as dialysis-dependent renal failure and AIDS, indicating that both unilateral and bilateral CNV have a profound impact on how patients feel about their overall health-related quality of life.
Figures
Similar articles
-
Surgical removal vs observation for subfoveal choroidal neovascularization, either associated with the ocular histoplasmosis syndrome or idiopathic: II. Quality-of-life findings from a randomized clinical trial: SST Group H Trial: SST Report No. 10.Arch Ophthalmol. 2004 Nov;122(11):1616-28. doi: 10.1001/archopht.122.11.1616. Arch Ophthalmol. 2004. PMID: 15534122 Free PMC article. Clinical Trial.
-
Surgical removal vs observation for idiopathic or ocular histoplasmosis syndrome-associated subfoveal choroidal neovascularization: Vision Preference Value Scale findings from the randomized SST Group H Trial: SST Report No. 17.Arch Ophthalmol. 2008 Dec;126(12):1626-32. doi: 10.1001/archopht.126.12.1626. Arch Ophthalmol. 2008. PMID: 19064840 Clinical Trial.
-
Health- and vision-related quality of life among patients with choroidal neovascularization secondary to age-related macular degeneration at enrollment in randomized trials of submacular surgery: SST report no. 4.Am J Ophthalmol. 2004 Jul;138(1):91-108. doi: 10.1016/j.ajo.2004.02.011. Am J Ophthalmol. 2004. PMID: 15234287 Clinical Trial.
-
Submacular surgery trials update.Ophthalmol Clin North Am. 2002 Dec;15(4):479-88. doi: 10.1016/s0896-1549(02)00052-4. Ophthalmol Clin North Am. 2002. PMID: 12515081 Review.
-
Complications of surgery for subfoveal choroidal neovascularization.Int Ophthalmol Clin. 2000 Winter;40(1):201-14. doi: 10.1097/00004397-200001000-00019. Int Ophthalmol Clin. 2000. PMID: 10713926 Review.
Cited by
-
Surgery for hemorrhagic choroidal neovascular lesions of age-related macular degeneration: quality-of-life findings: SST report no. 14.Ophthalmology. 2004 Nov;111(11):2007-14. doi: 10.1016/j.ophtha.2004.07.024. Ophthalmology. 2004. PMID: 15522365 Free PMC article. Clinical Trial.
-
Surgical removal vs observation for subfoveal choroidal neovascularization, either associated with the ocular histoplasmosis syndrome or idiopathic: II. Quality-of-life findings from a randomized clinical trial: SST Group H Trial: SST Report No. 10.Arch Ophthalmol. 2004 Nov;122(11):1616-28. doi: 10.1001/archopht.122.11.1616. Arch Ophthalmol. 2004. PMID: 15534122 Free PMC article. Clinical Trial.
-
The use of patient-reported outcome research in modern ophthalmology: impact on clinical trials and routine clinical practice.Patient Relat Outcome Meas. 2019 Jan 24;10:9-24. doi: 10.2147/PROM.S162802. eCollection 2019. Patient Relat Outcome Meas. 2019. PMID: 30774489 Free PMC article. Review.
-
Economic evaluation of treatment administration strategies of ganciclovir for cytomegalovirus retinitis in HIV/AIDS patients in Thailand: a simulation study.Pharmacoeconomics. 2007;25(5):413-28. doi: 10.2165/00019053-200725050-00005. Pharmacoeconomics. 2007. PMID: 17488139
-
What Is the Value of Preference Values for Patient-Centered Eye Care?JAMA Ophthalmol. 2018 Jun 1;136(6):664-665. doi: 10.1001/jamaophthalmol.2018.1537. JAMA Ophthalmol. 2018. PMID: 29800940 Free PMC article. No abstract available.
References
-
- Leibowitz HM, Krueger DE, Maunder LR, et al. The Framingham Eye Study Monograph: an ophthalmological and epidemiological study of cataract, glaucoma, diabetic retinopathy, macular degeneration, and visual acuity in a general population of 2631 adults, 1973–1975. Surv Ophthalmol. 1980;24(suppl):335–610. - PubMed
-
- Sommer A, Tielsch JM, Katz J, et al. Racial differences in the cause-specific prevalence of blindness in East Baltimore. N Engl J Med. 1991;325:1412–1417. - PubMed
-
- Klein R, Wang Q, Klein BEK, Moss SE, Meuer SM. The relationship of age-related maculopathy, cataract, and glaucoma to visual acuity. Invest Ophthalmol Vis Sci. 1995;36:182–191. - PubMed
-
- Rahmani B, Tielsch JM, Gottsch J, Quigley H, Javitt J, Sommer A. The cause-specific prevalence of visual impairment in an urban population: the Baltimore Eye Survey. Ophthalmology. 1996;103:1721–1726. - PubMed
-
- Macular Photocoagulation Study Group. Argon laser photocoagulation for ocular histoplasmosis: results of a randomized clinical trial. Arch Ophthalmol. 1983;101:1347–1357. - PubMed
