. 2005 Jan;79(1):67-78.
doi: 10.1128/JVI.79.1.67-78.2005.

Analysis of wild-type and mutant SL3-3 murine leukemia virus insertions in the c-myc promoter during lymphomagenesis reveals target site hot spots, virus-dependent patterns, and frequent error-prone gap repair

Affiliations

Analysis of wild-type and mutant SL3-3 murine leukemia virus insertions in the c-myc promoter during lymphomagenesis reveals target site hot spots, virus-dependent patterns, and frequent error-prone gap repair

Anne Ahlmann Nielsen et al. J Virol. 2005 Jan.

Abstract

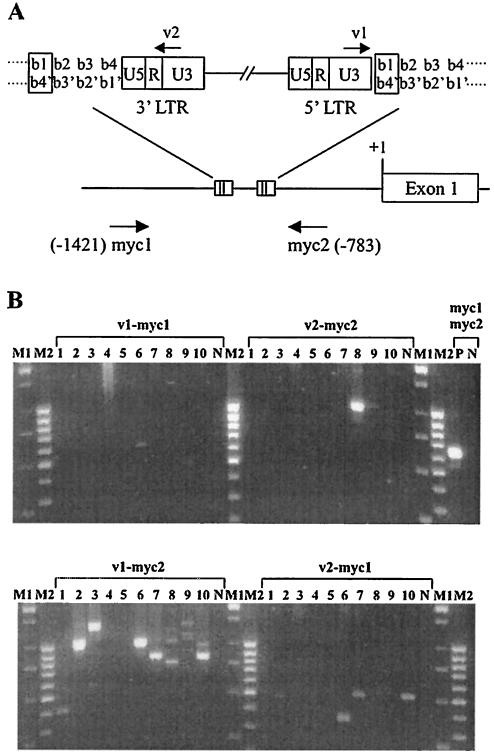
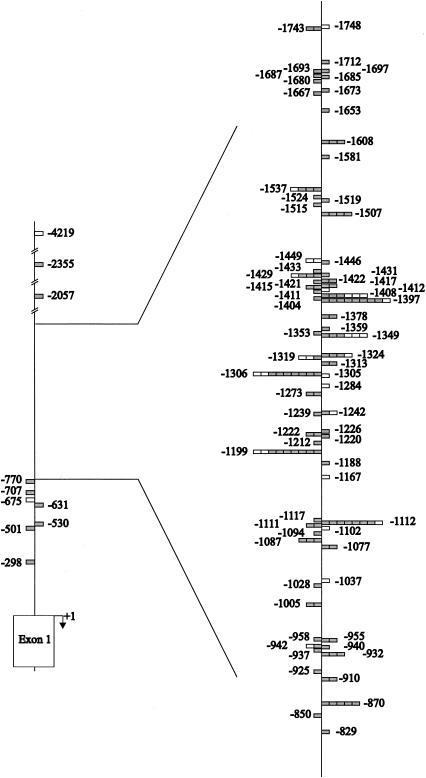
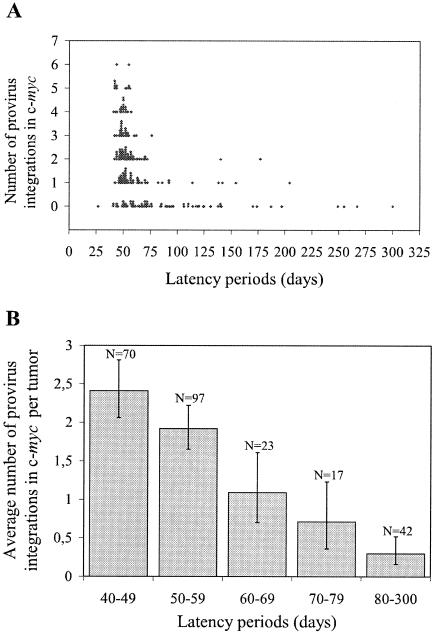
The murine leukemia retrovirus SL3-3 induces lymphomas in the T-cell compartment of the hematopoetic system when it is injected into newborn mice of susceptible strains. Previously, our laboratory reported on a deletion mutant of SL3-3 that induces T-cell tumors faster than the wild-type virus (S. Ethelberg, A. B. Sorensen, J. Schmidt, A. Luz, and F. S. Pedersen, J. Virol. 71:9796-9799, 1997). PCR analyses of proviral integrations in the promoter region of the c-myc proto-oncogene in lymphomas induced by wild-type SL3-3 [SL3-3(wt)] and the enhancer deletion mutant displayed a difference in targeting frequency into this locus. We here report on patterns of proviral insertions into the c-myc promoter region from SL3-3(wt), the faster variant, as well as other enhancer variants from a total of approximately 250 tumors. The analysis reveals (i) several integration site hot spots in the c-myc promoter region, (ii) differences in integration patterns between SL3-3(wt) and enhancer deletion mutant viruses, (iii) a correlation between tumor latency and the number of proviral insertions into the c-myc promoter, and (iv) a [5'-(A/C/G)TA(C/G/T)-3'] integration site consensus sequence. Unexpectedly, about 12% of the sequenced insertions were associated with point mutations in the direct repeat flanking the provirus. Based on these results, we propose a model for error-prone gap repair of host-provirus junctions.


Figures

FIG. 1.
FIG. 1.
Enhancer structures of wild-type and mutant SL3-3 MLVs used in the study (24, 25, 26). (A) The SL3-3(wt) enhancer located in U3 consists of a 72-bp direct repeat followed by a third repetition of 34 bp containing binding sites for a variety of transcription factors. Both SL3-3(turbo) and SL3-3(2Δ18-2) harbor two identical 18-bp deletions encompassing the NF1 site. In addition, the SL3-3(turbo) enhancer contains an extra 72-bp wt repeat. SL3-3(GTT) and SL3-3(TUMdm) are both Runx binding site mutants. The SL3-3(GTT) enhancer contains the GTT-to-TGG mutation in both Runx site I binding sites. The SL3-3(TUMdm) enhancer harbors several alterations compared to the SL3-3(wt) enhancer structure. In addition to an extra 72-bp repeat, the enhancer harbors two identical 28-bp deletions encompassing the NF1 site. Furthermore, GTT-to-TGG and GAC-to-TCA mutations are present in Runx site I and site II, respectively. A T-to-G base substitution is present in the last Runx site I. (B) The enhancer structures are illustrated schematically with boxes; deletions are marked by gaps, and Runx binding site mutations are indicated by letters. WT, wild type.
FIG. 2.
FIG. 2.
Detection of proviral integrations in the c-myc promoter region. (A) Provirus integrations in the c-myc promoter region in the SL3-3(wt) and variant-induced tumors were detected by using a PCR method employing two virus-specific (v1 and v2) and two gene-specific (myc1 and myc2) primers. PCRs with the four primer combinations v1-myc1, v2-myc1, v1-myc2, and v2-myc2 were performed in order to detect viruses integrated in either orientation. The four base pairs b1-b4′ to b4-b1′ duplicated during proviral integrations of MLVs are shown. We have defined the first base pair (in the c-myc sense orientation) in this duplicated stretch of bases (b1-b4′) to be the site of integration (boxed). (B) The amplified PCR products were visualized on ethidium bromide-stained agarose gels. As examples, amplification products obtained from 10 SL3-3(turbo)-induced tumors in male mice are shown. M1, 1-kb ladder (2, 1.5, 1, 0.75, 0.5, and 0.25 kb); M2, 100-bp ladder (1,031, 900, 800, 700, 600, 500, 400, 300, and 200 bp, respectively); N, negative control; P, positive control. Tumor numbers and primer combinations are listed above the lanes.
FIG. 3.
FIG. 3.
Integration sites in the c-myc promoter region. Integration sites in the c-myc promoter obtained by gene-specific PCRs are shown relative to the promoter sequence with the GenBank and EMBL accession number NT_078782. The region from approximately −800 to −1,800 bp upstream of exon 1 is enlarged in order to illustrate the densely packed integration sites. Each proviral integration is indicated by a box, and the orientations are contrasted, with white indicating the sense direction and grey indicating the antisense direction.
FIG. 4.
FIG. 4.
Virus-dependent integration pattern in the c-myc promoter region. (A) The promoter region is divided into sections of 30 bp, and within each section the percentages of all virus insertions are calculated. (B) Similarly, the percentages of SL3-3(wt) and SL3-3(turbo) insertions within 30-bp windows from positions −827 to −1756 are shown (this region is indicated by lines in panel A; i.e., a total of 10 insertions outside this region are not included). (C) The numbers of SL3-3(wt) and SL3-3(turbo) insertions at individual positions from positions −1396 to −1427 are illustrated.
FIG. 5.
FIG. 5.
Correlation between tumor latency and number of proviral integrations in the c-myc promoter region. (A) The number of provirus insertions in the individual tumors is shown as a function of the latency period. Identical data points (latency period and number of integrations) are shown above each other. The numbers of different integrations in c-myc in the individual tumors are obtained by counting the numbers of amplification products achieved in the repeated rounds of PCRs. (B) The average number of proviral integrations in the c-myc gene as a function of latency period to disease development is shown along with 95% confidence intervals. The total observation period of 300 days has been divided into subgroups of 10 days each; however, due to the small amount of data samples for each latency period above 80 days, these latency periods have been grouped. N, number of mice within a given subgroup.
FIG. 6.
FIG. 6.
Model for error-prone gap repair at proviral integration. The figure illustrates the introduction of mutations at either virus-chromosome junction. (A) Schematic representation of the SL3-3 proviral DNA copy of the genome. The 3′-LTR and 5′-LTR att sites are shown. (B) The integration step is initiated by 3′ processing of two T nucleotides. (C) During strand transfer, the two DNA ends are joined in concert to the chromosomal target DNA 4 bp apart. The target sequence VTAB (V denotes A, C, or G; B denotes C, G, or T) is shown, and the T nucleotide located at the second position is underlined. Due to base pairing, the 5′ dinucleotide overhangs are not removed during the gap repair process. (D) Subsequent editing of the mismatching base pairs (marked with an asterisk) generates the V-to-T mutation at either junction. The figure illustrates the introduction of mutations at both junctions for the same proviral integration; however, it is noted that this is never observed in our data set.

Similar articles

Cited by

References

    1. Agresti, A. 1990. Categorical data analysis. Wiley, New York, N.Y.
    1. Akagi, K., T. Suzuki, R. M. Stephens, N. A. Jenkins, and N. G. Copeland. 2004. RTCGD: retroviral tagged cancer gene database. Nucleic Acids Res. 32:D523-D527. - PMC - PubMed
    1. Amtoft, H. W., A. B. Sørensen, C. Bareil, J. Schmidt, A. Luz, and F. S. Pedersen. 1997. Stability of AML1 (core) site enhancer mutations in T lymphomas induced by attenuated SL3-3 murine leukemia virus mutants. J. Virol. 71:5080-5087. - PMC - PubMed
    1. Baekelandt, V., A. Claeys, P. Cherepanov, E. De Clercq, B. De Strooper, B. Nuttin, and Z. Debyser. 2000. DNA-dependent protein kinase is not required for efficient lentivirus integration. J. Virol. 74:11278-11285. - PMC - PubMed
    1. Ball, J. K., H. Diggelmann, G. A. Dekaban, G. F. Grossi, R. Semmler, P. A. Waight, and R. F. Fletcher. 1988. Alterations in the U3 region of the long terminal repeat of an infectious thymotropic type B retrovirus. J. Virol. 62:2985-2993. - PMC - PubMed

Publication types

MeSH terms

Substances

LinkOut - more resources