. 2005 Jan;79(1):326-40.
doi: 10.1128/JVI.79.1.326-340.2005.

Role for tumor necrosis factor alpha in murine cytomegalovirus transcriptional reactivation in latently infected lungs

Affiliations

Role for tumor necrosis factor alpha in murine cytomegalovirus transcriptional reactivation in latently infected lungs

Christian O Simon et al. J Virol. 2005 Jan.

Abstract

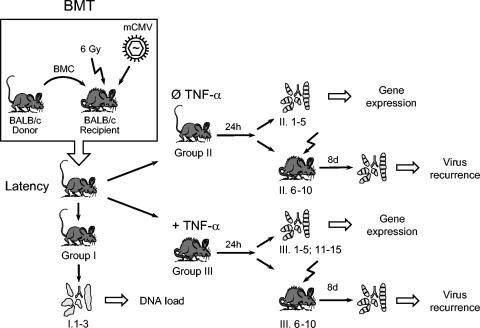
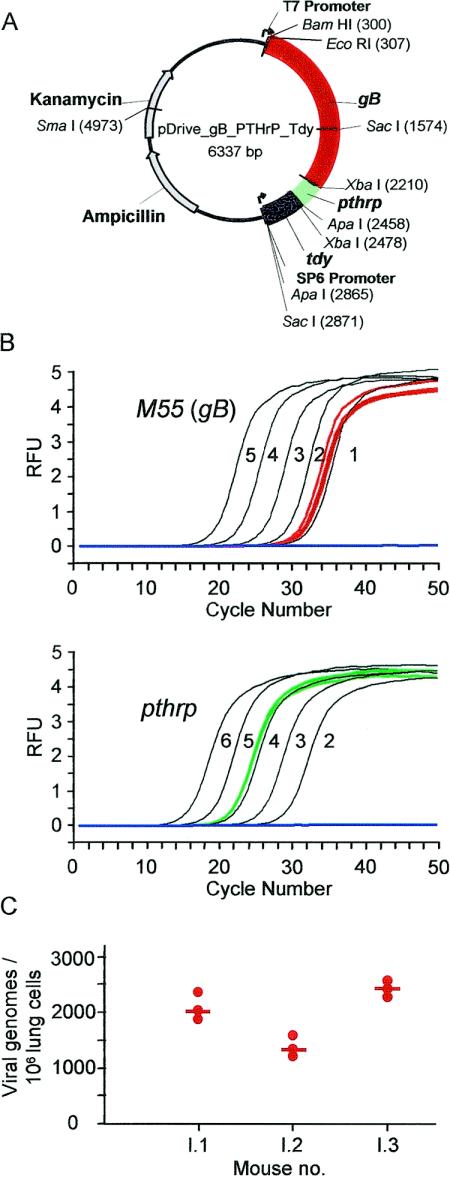
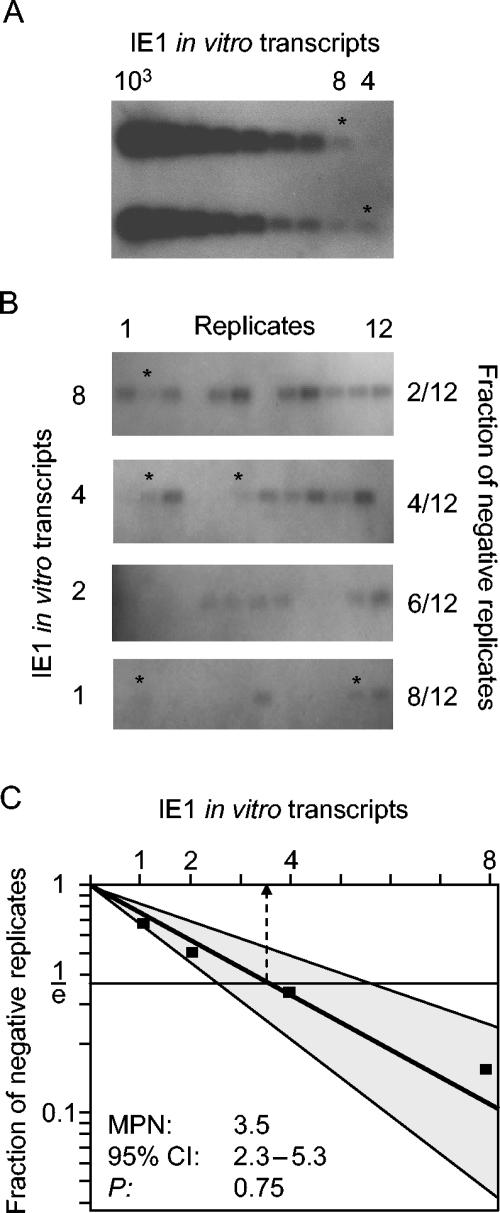
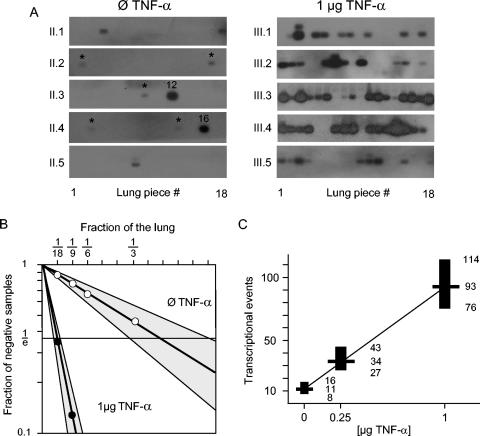
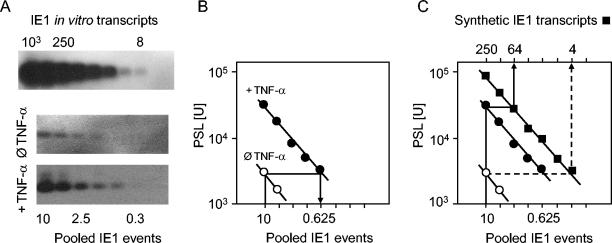
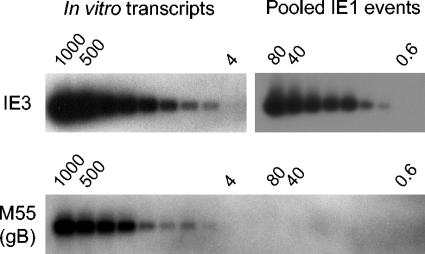
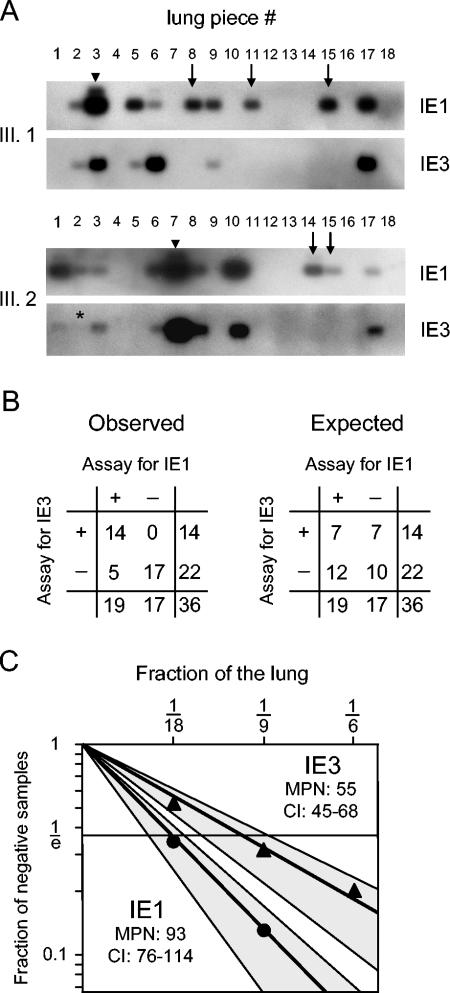
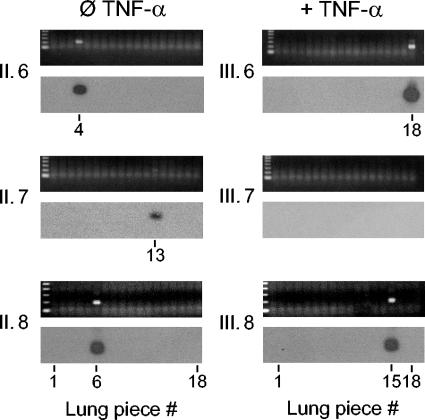
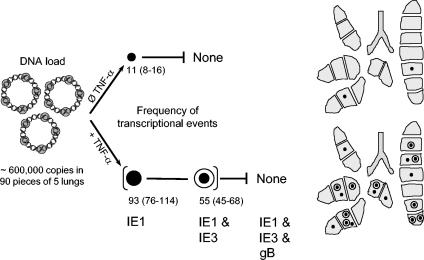
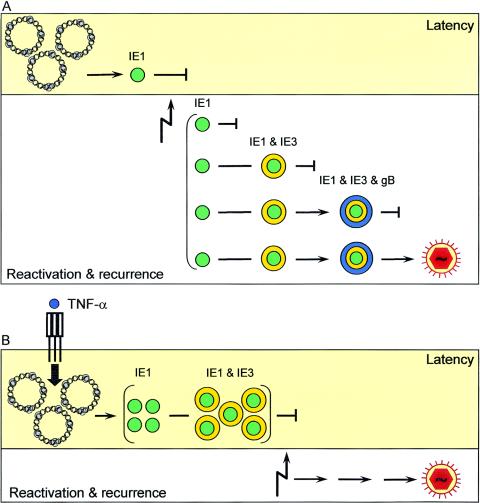
Interstitial pneumonia is a major clinical manifestation of primary or recurrent cytomegalovirus (CMV) infection in immunocompromised recipients of a bone marrow transplant. In a murine model, lungs were identified as a prominent site of CMV latency and recurrence. Pulmonary latency of murine CMV is characterized by high viral genome burden and a low incidence of variegated immediate-early (IE) gene expression, reflecting a sporadic activity of the major IE promoters (MIEPs) and enhancer. The enhancer-flanking promoters MIEP1/3 and MIEP2 are switched on and off during latency in a ratio of approximately 2:1. MIEP1/3 latency-associated activity generates the IE1 transcript of the ie1/3 transcription unit but not the alternative splicing product IE3 that encodes the essential transactivator of early gene expression. Splicing thus appeared to be an important checkpoint for maintenance of latency. In accordance with previous work of others, we show here that signaling by the proinflammatory cytokine tumor necrosis factor alpha (TNF-alpha) activates IE1/3 transcription in vivo. As an addition to current knowledge, Poisson distribution analysis revealed an increased incidence of IE1/3 transcriptional events as well as a higher amount of transcripts per event. Notably, TNF-alpha promoted the splicing to IE3 transcripts, but transcription did not proceed to the M55/gB early gene. Moreover, the activated transcriptional state induced by TNF-alpha did not predispose latently infected mice to a higher incidence of virus recurrence after hematoablative treatment. In conclusion, TNF-alpha is an important inductor of IE gene transcriptional reactivation, whereas early genes downstream in the viral replicative cycle appear to be the rate-limiting checkpoint(s) for virus recurrence.


Figures

FIG. 1.
FIG. 1.
Experimental regimen and time course. Syngeneic BMT was performed with BALB/c mice as donors and recipients by transplantation of donor bone marrow cells (BMC) to recipients γ-irradiated with a dose of 6 Gy. The BMT recipients were infected with mCMV, and the clearance of productive infection was monitored longitudinally by means of declining viral DNA load in the tail vein blood until the PCR detection limit was reached. Latency analyses were performed 1 year after primary infection. The latently infected BMT recipients were randomized to form three groups. Group I was used to determine the latent viral DNA load in the lungs. Groups II and III were compared to determine the effect of TNF-α on latency-associated viral gene expression and on the incidence of virus recurrence after secondary hematoablative γ-irradiation with a dose of 6.5 Gy. Both parameters were measured for 18 pieces per lung to facilitate frequency estimates by Poisson distribution statistics. The clinical health status of the mice is symbolized. For further details, see the text.
FIG. 2.
FIG. 2.
Viral DNA load in latently infected lungs. (A) Physical map of plasmid pDrive_gB_PTHrP_Tdy that was constructed to serve as a standard in LightCycler real-time PCR. It encompasses the mCMV gene M55/gB (red) as well as the cellular genes pthrp (green) and tdy (black). (B) Amplification profiles for 101 to 106 copies (labeled by exponents 1 to 6, respectively) of the linearized standard plasmid and of a triplicate sample of lung DNA. A control containing all reaction components except sample DNA (water control) is shown in blue. At a glance, ∼10 copies of the viral gene M55/gB (red) correspond to ∼10,000 copies of the cellular gene pthrp (green). RFU, relative fluorescence units. (C) Viral DNA load determined individually for the lungs of the three mice of group I. Each red dot represents the mean value of a sample DNA triplicate determined with one standard curve. As DNA quantitation is subject to error, the determination was repeated three times with independent standard curves and independent DNA measurements for the sample DNA. The median values are marked by red horizontal bars.
FIG. 3.
FIG. 3.
Sensitivity of the IE1-specific RT-PCR. (A) Two independent titrations of IE1 in vitro transcripts. Shown are Southern blot autoradiographs of 188-bp cDNA amplificates after hybridization with the γ-32P-end-labeled probe IE1-P that is directed against the exon 3-exon 4 splicing junction of transcription unit ie1/3. Titration end points are marked by asterisks. (B) Limiting dilution of IE1 in vitro transcripts in 12 replicates per indicated copy number. Asterisks mark faint signals, which are visible on the original roentgen film. (C) Limiting dilution graph showing the intercept-free linear regression line and its 95% CI (shaded area), calculated by the maximum-likelihood method. Based on Poisson distribution statistics, the MPN is the abscissa coordinate (dashed arrow) of the point of intersection between 1/e and the regression line. P, probability value indicating the goodness of fit.
FIG. 4.
FIG. 4.
Effect of TNF-α on the frequency of IE1-specific transcription in latently infected lungs. (A) Lungs were subdivided into 18 pieces, and IE1-specific RT-PCR was performed with poly(A)+ RNA isolated from the individual pieces. Basal latency-associated IE1 transcription was tested for five mice of group II (left panel) and induced IE1 transcription was tested for five mice of group III (right panel) 24 h after i.v. infusion of saline (Ø TNF-α) and of 1 μg of recombinant murine TNF-α, respectively. Shown are the Southern blot autoradiographs after hybridization with probe IE1-P. Asterisks mark faint signals that are visible on the original roentgen film. The fraction of signal-negative pieces is the information that enters the Poisson distribution analysis. (B) Limiting dilution graphs showing the linear regression lines with the 95% confidence intervals (shaded areas) for the frequency of basal expression (Ø TNF-α, open circle; P = 0.99) and of TNF-induced expression (1 μg of TNF-α, closed circle; P = 0.94). (C) Graph illustrating the linear relation between the number of transcriptional events or foci and the dose of TNF-α, including the results for 0.25 μg of TNF-α obtained with mice III.11 to III.15. The number of transcriptional events refers to the 90 lung tissue pieces altogether of all five lungs tested per group. Most probable numbers, as derived from the limiting dilution analyses in panel B, are indicated by horizontal bars, and the extensions of the vertical bars represent the 95% confidence intervals. As a reading example, the lungs of mice III.1 to III.5 altogether contained 93 foci of IE1 transcription within 90 pieces, with a predicted variance of between 76 and 114 foci.
FIG. 5.
FIG. 5.
Quantitation of the amount of IE1 transcripts. Aliquots of poly(A)+ RNA from the IE1-positive lung pieces of the experiment shown in Fig. 4A were pooled separately for groups II.1 to II.5 and III.1 to III.5 representing basal (Ø TNF-α) and TNF-induced (1 μg of TNF-α) IE1 transcription, respectively. Serial dilutions were made, which contained 1% of the material that corresponded to defined numbers of transcriptional events, starting the titration series with 10 events. (A) Titration series of IE1 in vitro transcripts (top panel) and of lung-derived poly(A)+ RNA from groups II and III normalized to the number of IE1 events (bottom panels). Shown are the Southern blot autoradiographs after hybridization with probe IE1-P. (B) Quantitation of radioactivity on the blots by phosphorimaging revealing a 16-fold difference in transcript amount between basal transcription (open circles) and TNF-induced transcription (closed circles). PSL, phosphostimulated luminescence in relative units. (C) Same graphs as those in panel B but with the standard curve (closed squares) included. As a reading example, a 1/100 fraction of 10 foci of the TNF-induced group III (closed circles) contains ∼64 IE1 transcripts; that is, one IE1 focus in this group contains ∼640 IE1 transcripts.
FIG. 6.
FIG. 6.
Absence of M55/gB transcripts despite transactivator IE3 splicing. Aliquots of poly(A)+ RNA from the 58 IE1-positive lung pieces of the TNF-induced group (mice III.1 to III.5 in Fig. 4A) were pooled. Serial dilutions were made, which contained 1% of the material that corresponded to defined numbers of transcriptional IE1 events, starting the titration series with 80 events. With a sample amount of ∼1 μg of poly(A)+ RNA in the RT-PCRs, the highest attainable assay sensitivity was reached. Standard titrations were performed with in vitro-synthesized IE3 and M55/gB transcripts, starting with 1,000 transcripts. Shown are Southern blot autoradiographs after hybridization with specific, γ-32P-end-labeled probes. In the case of IE3-specific RT-PCR, a 229-bp cDNA amplificate was detected with probe IE3-P that was directed against the exon 3-exon 5 splicing junction of transcription unit ie1/3. In the case of M55/gB-specific RT-PCR, a 405-bp cDNA amplificate was detected with the internal probe gB-P.
FIG. 7.
FIG. 7.
Correlative patterns of IE1 and IE3 expression in pieces of latently infected lungs after induction with TNF-α. (A) Piece-by-piece RT-PCR analysis of the presence of IE1 and IE3 transcripts documented exemplarily for two mice of the TNF-induced group (mice III.1 and III.2, which had already been tested for IE1 in the experiment depicted in Fig. 4A). Note that IE1 expression was retested with an independent sample of the poly(A)+ RNA to document pattern reproducibility. Shown are Southern blot autoradiographs after hybridization with probes IE1-P and IE3-P, respectively. The asterisk marks a faint signal that is visible on the original roentgen film. Arrows mark lung pieces that contain only IE1 transcripts. Arrowheads point to pieces of high expression for which the IE1/3 precursor RNA was detected in the form of an RT-dependent, 310-bp cDNA amplificate. (B) Contingency table analysis. To evaluate a possible correlation between IE1 and IE3 expression, the pattern data were organized in a 2-by-2 contingency table (observed pattern), and the null hypothesis of independent distribution (expected pattern in integers) was tested by applying Fisher's exact probability test. The expected value for double-positive pieces was 7.4. Null hypothesis was rejected with a P value of0.000 that is <0.025 (one-tailed test for correlation). (C) Estimation of the frequencies of transcriptional foci based on the results from all 90 lung pieces derived from mice III.1 to III.5. Limiting dilution graphs show the linear regression lines with the 95% CI (shaded areas) for IE1 transcripts (closed circles) and IE3 transcripts (closed triangles). Based on the data from panel B, the frequency of IE3-positive foci can be interpreted as the frequency of double-positive foci.
FIG. 8.
FIG. 8.
Influence of TNF-α on the incidence of virus recurrence. At 24 h after i.v. infusion of saline (Ø TNF-α) and of 1 μg of recombinant murine TNF-α (+ TNF-α), mice of groups II and III, respectively, were immunosuppressed by total-body γ-irradiation with a dose of 6.5 Gy. On day 8, lung pieces were homogenized and tested individually for the presence of infectious virus by centrifugal infection of permissive indicator cell cultures followed by IE1-specific RT-PCR after 72 h of cultivation. Shown are the ethidium bromide-stained gels (top panels) and the corresponding Southern blot hybridizations with probe IE1-P (bottom panels). Frequency estimates (extrapolated to 90 pieces) were 6 (CI, 3 to 9) and 4 (CI, 2 to 7), respectively. As indicated by the overlap of the 95% CI, this is not a significant difference.
FIG. 9.
FIG. 9.
Summary of results for latency-associated transcription. Data for TNF-α refer to the dose of 1 μg (+ TNF-α). Frequency estimates for transcriptional events or foci refer to 90 lung pieces of five mice and are given as MPN (95% CI). Latent viral chromosomes are symbolized as coils. The difference between the two groups is illustrated by topographical lung maps showing the types (IE1, closed circle; IE1 and IE3, closed circle within open circle), numbers, and distribution of foci in statistically representative lungs. For this, the fraction of pieces containing n (n = 0, 1, 2, 3, or 4) foci, F(n), was first calculated separately for IE1 and IE3, and the distribution of foci was then defined under the premise that IE3 foci (open circles) coincide with IE1 foci (closed circles). See the legend of Fig. 7B for the justification of this premise. Note that individual lungs with a transcriptional activity that is higher than the representative transcriptional activity contained a maximum of four foci in a piece (data not shown).
FIG. 10.
FIG. 10.
Models of CMV latency and reactivation. (A) Multistep model of CMV reactivation, modified from a model by Kurz and Reddehase (34). Latent viral chromosomes are symbolized as coils. During latency, transcription is arrested at IE1 (closed green circles). After induction of reactivation by γ-rays, some foci of transcription remain arrested at IE1, others contain spliced IE3 transcripts (yellow shell), yet others proceed to M55/gB transcription (blue shell), and only few complete the productive cycle and release infectious virus (virion symbol [red]). (B) Role of TNF-α (this report). Through the NF-κB/AP1 signaling pathways, TNF-α enhances MIE gene transcription by >100-fold and promotes differential splicing, which leads to IE1 foci and IE1 and IE3 foci in a ratio of ∼4/5. This activated state, however, does not predispose for an increased incidence of virus recurrence after γ-ray-induced reactivation. It is proposed that multiple checkpoints downstream in the productive cycle of gene expression, putatively defined by random patterns of locally closed and open chromatin-like structures, are rate limiting for recurrence.

Similar articles

Cited by

References

    1. Adam, E., V. Quivy, F. Bex, A. Chariot, Y. Collette, C. Vanhulle, S. Schoonbroodt, V. Goffin, T. L. Nguyen, G. Gloire, G. Carrard, B. Friguet, Y. De Launoit, A. Burny, V. Bours, J. Piette, and C. Van Lint. 2003. Potentiation of tumor necrosis factor-induced NF-κB activation by deacetylase inhibitors is associated with a delayed cytoplasmic reappearance of IκBα. Mol. Cell. Biol. 23:6200-6209. - PMC - PubMed
    1. Aggarwal, B. B. 2003. Signalling pathways of the TNF superfamily: a double-edged sword. Nat. Rev. Immunol. 3:745-756. - PubMed
    1. Alterio de Goss, M., R. Holtappels, H.-P. Steffens, J. Podlech, P. Angele, L. Dreher, D. Thomas, and M. J. Reddehase. 1998. Control of cytomegalovirus in bone marrow transplantation chimeras lacking the prevailing antigen-presenting molecule in recipient tissues rests primarily on recipient-derived CD8 T cells. J. Virol. 72:7733-7744. - PMC - PubMed
    1. Angulo, A., P. Ghazal, and M. Messerle. 2000. The major immediate-early gene ie3 of mouse cytomegalovirus is essential for viral growth. J. Virol. 74:11129-11136. - PMC - PubMed
    1. Balthesen, M., M. Messerle, and M. J. Reddehase. 1993. Lungs are a major organ site of cytomegalovirus latency and recurrence. J. Virol. 67:5360-5366. - PMC - PubMed

Publication types

MeSH terms