. 2004 Dec 14;32(22):6540-7.
doi: 10.1093/nar/gkh999. Print 2004.

Initiation of translocation by Type I restriction-modification enzymes is associated with a short DNA extrusion

Affiliations

Initiation of translocation by Type I restriction-modification enzymes is associated with a short DNA extrusion

John van Noort et al. Nucleic Acids Res. .

Abstract

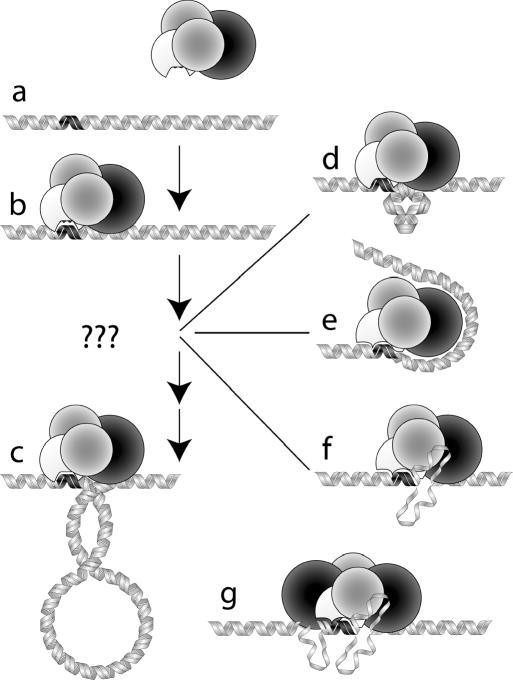
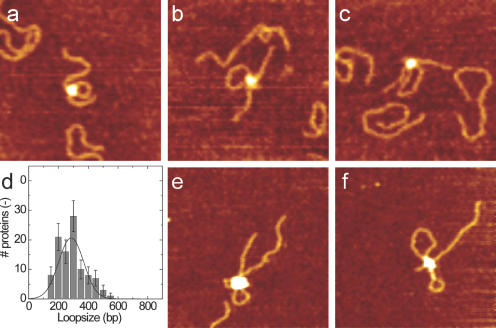
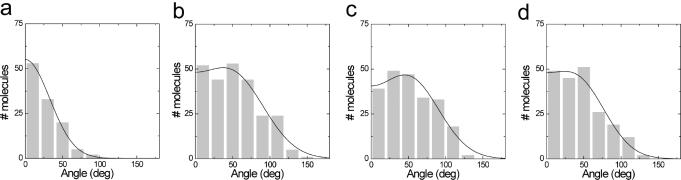
Recognition of 'foreign' DNA by Type I restriction-modification (R-M) enzymes elicits an ATP-dependent switch from methylase to endonuclease activity, which involves DNA translocation by the restriction subunit HsdR. Type I R-M enzymes are composed of three (Hsd) subunits with a stoichiometry of HsdR2:HsdM2:HsdS1 (R2-complex). However, the EcoR124I R-M enzyme can also exist as a cleavage deficient, sub-assembly of HsdR1:HsdM2:HsdS1 (R1-complex). ATPS was used to trap initial translocation complexes, which were visualized by Atomic Force Microscopy (AFM). In the R1-complex, a small bulge, associated with a shortening in the contour-length of the DNA of 8 nm, was observed. This bulge was found to be sensitive to single-strand DNA nucleases, indicative of non-duplexed DNA. R2-complexes appeared larger in the AFM images and the DNA contour length showed a shortening of approximately 11 nm, suggesting that two bulges were formed. Disclosure of the structure of the first stage after the recognition-translocation switch of Type I restriction enzymes forms an important first step in resolving a detailed mechanistic picture of DNA translocation by SF-II DNA translocation motors.


Figures

Figure 1
Figure 1
The DNA translocation process for the R1-complex. (a) The black region on the DNA represents the DNA binding (recognition) site of the enzyme, which is represented by the four globular subunits of the R1-complex: HsdS (white), HsdM (grey) and HsdR (black). (b) HsdS is bound to the DNA at the recognition site and HsdR begins to contact adjacent DNA sequences. (c) The motor translocates adjacent DNA through the motor/DNA complex, which remains tightly bound to the recognition sequence. Translocation produces an expanding loop of negatively supercoiled DNA. In the early stages of translocation, a very small loop would require a significant energetic penalty and is thus unlikely. (d) The inherent stiffness of DNA prevents bending over short distances and a bulge of the type shown would require a large amount of energy from protein–DNA interactions. (e) Wrapping of DNA around the HsdR subunit in an attempt to overcome the problem associated with bending the relatively stiff DNA. (f) Alternatively, unwinding of DNA can be used to overcome the problems associated with the persistence length of DNA, resulting in an extrusion or a bubble of ssDNA. (g) R2 initial complexes exhibit a much larger, more intricate structure that is more difficult to analyse with AFM imaging.
Figure 2
Figure 2
AFM images of DNA translocation. Typical images of translocation activity by R1-complex after incubation for (a) 10 s, (b) 30 s and (c) 60 s in the presence of ATP and 724 bp DNA fragments, containing a single recognition site at 175 bp. At the position of the protein, which shows up as a white globular feature, one small DNA loop is observed that increases in size with longer incubation times. Scan range, 250 nm; z range, 3 nm. (d) Distribution of the loop size after incubation for 10 s. Translocation distances were fitted with a Gaussian distribution, resulting in an average translocation distance of 2.8 × 10² bp. (e and f) R2 complexes on 2364 bp DNA after incubation with ATP for several minutes. As expected, double loops of DNA are formed. Scan range, 500 nm; z range, 5 nm.
Figure 3
Figure 3
AFM images of initial complex formation of MTase + HsdR(R124I). Two typical AFM images of protein–DNA complexes consisting of R1- (a and b) and R2-complexes (c and d), with and without ATPγS. On the right, the corresponding measured contour length distributions are plotted of free DNA (black) and complexed-DNA (grey). Red lines indicate the fitted mean contour length. Arrows indicate a small extrusion that is only observed when R1-complex is incubated with ATPγS. Analysis shows a decrease in contour length of 8 nm for R1-complexes and 11 nm for R2-complexes incubated in the presence of ATPγS. Scan range, 125 nm; z range, 3 nm.
Figure 4
Figure 4
DNA bending by MTase and R1 complexes. Histograms of the distributions of bend angles. Distributions are truncated at 0°, as the direction of bending cannot be determined. Black lines represent fits to truncated Gaussian distributions defined by the average angle α, width σ and an arbitrary normalization factor: (a) DNA α = 0°, σ = 65° ± 1° (mean ± standard error), (b) Mtase + DNA α = 49° ± 3, σ = 86° ± 9°, (c) R1-complex + DNA α = 51° ± 3°, σ = 80° ± 7° and (d) R1-complex + DNA in the presence of ATPγS α = 40° ± 3°, σ = 75° ± 9°.
Figure 5
Figure 5
P1 nuclease digestion of initial complexes. pCFD30 plasmid DNA was used to analyse the effect of P1 nuclease on bulge formation. Lane 1, 1 kb marker; Lanes 2–11, pCFD30; P1, R2-complex, R1-complex, ATPγS and ATP were added as described in the table. P1 digestion in the presence of ATPγS results in increased nicking of covalently closed circular DNA (cccDNA) to produce open circular DNA (ocDNA). R2-complex in the presence of ATP induces DNA cleavage as expected.

Similar articles

Cited by

References

    1. Murray N.E. (2000) Type I restriction systems: sophisticated molecular machines (a legacy of Bertani and Weigle). Microbiol. Mol. Biol. Rev., 64, 412–434. - PMC - PubMed
    1. Yuan R., Hamilton,D.L. and Burckhardt,J. (1980) DNA translocation by the restriction enzyme from E.coli K. Cell, 20, 237–244. - PubMed
    1. Endlich B. and Linn,S. (1985) The DNA restriction endonuclease of Escherichia coli B. I. Studies of the DNA translocation and the ATPase activities. J. Biol. Chem., 260, 5720–5728. - PubMed
    1. Taylor I., Patel,J., Firman,K. and Kneale,G.G. (1992) Purification and biochemical characterisation of the EcoR124 modification methylase. Nucleic Acids Res., 20, 179–186. - PMC - PubMed
    1. Janscák P., Dryden,D. and Firman,K. (1998) Analysis of the subunit assembly of the type IC restriction-modification enzyme EcoR124I. Nucleic Acids Res., 26, 4439–4445. - PMC - PubMed

Publication types

MeSH terms