. 2004 Dec;114(12):1732-40.
doi: 10.1172/JCI23083.

Natural population dynamics and expansion of pathogenic clones of Staphylococcus aureus

Affiliations

Natural population dynamics and expansion of pathogenic clones of Staphylococcus aureus

Damian C Melles et al. J Clin Invest. 2004 Dec.

Abstract

The population structure of Staphylococcus aureus carried by healthy humans was determined using a large strain collection of nonclinical origin (n = 829). High-throughput amplified fragment length polymorphism (AFLP) analysis revealed 3 major and 2 minor genetic clusters of S. aureus, which were corroborated by multilocus sequence typing. Major AFLP cluster I comprised 44.4% of the carriage isolates and showed additional heterogeneity whereas major AFLP groups II and III presented 2 homogeneous clusters, including 47.3% of all carriage isolates. Coanalysis of invasive S. aureus strains and epidemic methicillin-resistant S. aureus (MRSA) revealed that all major clusters contained invasive and multiresistant isolates. However, clusters and subclusters with overrepresentation of invasive isolates were also identified. Bacteremia in elderly adults, for instance, was caused by a IVa cluster-derived strain significantly more often than by strains from other AFLP clusters. Furthermore, expansion of multiresistant clones or clones associated with skin disease (impetigo) was detected, which suggests that epidemic potential is present in pathogenic strains of S. aureus. In addition, the virulence gene encoding Panton-Valentine leukocidin was significantly enriched in S. aureus strains causing abscesses and arthritis in comparison with the carriage group. We provide evidence that essentially any S. aureus genotype carried by humans can transform into a life-threatening human pathogen but that certain clones are more virulent than others.


Figures

Figure 1
Figure 1
2D hierarchical clustering of the 1,056 S. aureus strains. The green/red figure represents 155,232 binary outcomes generated by ht-AFLP with 147 marker fragments. Marker absence corresponds with green and marker presence with red. The dendrogram on the y axis represents the phylogenetic clustering of the 1,056 strains. The dendrogram on the x axis shows the clustering of the 147 AFLP markers, many of which segregate in specific groups. These groups are cluster specific, and some of these groups are shown as boxes in the figure (A through G). The colored, striped bars on the right represent the distribution of the invasive strains (children and elderly adults), the impetigo isolates, the MRSA strains, and the reference strains. The carriage strains (n = 829) are not pointed out separately. In conjunction with PCA 3 major (I, II, III) and 2 minor (IVa, IVb) branches were identified; these are represented by the black and white bar on the right of the figure.
Figure 2
Figure 2
PCA of the 1,056 S. aureus strains. The different cubes (plotted in 3D space), colored according to the source, represent every strain in the study. Each axis represents the score calculated for that strain on each PC. The distribution of the strains is shown from 2 different angles (A and B). The 5 circles indicate the different phylogenetic AFLP clusters.
Figure 3
Figure 3
Cluster analysis of the 1,056 S. aureus strains using OmniViz. The cells in the correlation visualization are colored by Pearson’s correlation coefficient values with deeper colors indicating higher positive (red) or negative (blue) correlations. The scale bar (underneath the figure) indicates 100% correlation (red) toward 100% anticorrelation (blue). In order to reveal correlation patterns, a matrix-ordering method was applied to rearrange the samples. The OmniViz correlation view generated with 1,056 strains was adapted so that descriptive (clinical) parameters could be plotted directly adjacent to the original diagonal. The black and white bar on the left indicates the 5 AFLP groups based on PCA. This figure shows additional subclustering in major group I (a–j) as well as in minor group IVa, indicated by several lines. The dotted lines identify blocks of minimal changes in 1 cluster or subcluster. The corresponding MLST data (see also Figure 4) are shown on the right side of the figure. The distributions of the strains from different origins are visualized as red lines in the diagonal red and green bars of the figure (numbered 2–9). Variable 1 indicates the different AFLP clusters based on PCA; 2, carriage isolates, children (n = 400); 3, carriage isolates, elderly adults (n = 429); 4, invasive isolates, total (n = 164); 5, invasive isolates, children (n = 74); 6, invasive isolates, elderly adults (n = 90); 7, invasive isolates, children (deep-seated and soft-tissue infections) (n = 18); 8, impetigo isolates (n = 40); 9, MRSA (n = 21).
Figure 4
Figure 4
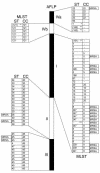
AFLP analysis versus MLST analysis of S. aureus. The bar in the center of the figure represents the 1,056 strains divided into the 5 phylogenetic AFLP clusters (similar to those defined at the right side of Figure 1). MLST data is shown for 77 S. aureus strains, which are spread over the different AFLP clusters. The order of the MLST sequence types in this figure is determined by the location of the strain in the AFLP dendrogram (Figure 1). *Unknown ST; **6 of the 7 loci are similar to the particular ST; ***data not available.
Figure 5
Figure 5
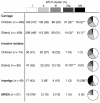
Distribution of S. aureus strains in the 5 phylogenetic branches. *Overrepresentation of carriage in elderly adults (Fisher’s exact test, P = 0.01); **overrepresentation of carriage in children (Fisher’s exact test, P < 0.0001); ***proportionately more bacteremia-associated strains from elderly adults as compared to carriage strains from the same group (3% vs. 10%; Fisher’s exact test, P = 0.0095); proportionately fewer impetigo-associated strains as compared to carriage in children (8% vs. 26%; Fisher’s exact test, P = 0.01); overrepresentation of impetigo-associated strains as compared to carriage in children (38% vs. 5%; Fisher’s exact test, P < 0.0001); –proportionately more MRSA strains as compared to all carriage isolates (76% vs. 44%; Fisher’s exact test, P < 0.006).

Comment in

References

    1. Steinberg JP, Clark CC, Hackman BO. Nosocomial and community-acquired Staphylococcus aureus bacteremias from 1980 to 1993: impact of intravascular devices and methicillin resistance. Clin. Infect. Dis. 1996;23:255–259. - PubMed
    1. Staphylococcus Laboratory, Statens Serum Institut. 2003. Annual report on Staphylococcus aureus bacteraemia cases 2001. Staphylococcus Laboratory, National Center for Antimicrobials and Infection Control, Statens Serum Institut. Copenhagen, Denmark. 9 pp.
    1. Luzar MA, et al. Staphylococcus aureus nasal carriage and infection in patients on continuous ambulatory peritoneal dialysis. N. Engl. J. Med. 1990;322:505–509. - PubMed
    1. Yu VL, et al. Staphylococcus aureus nasal carriage and infection in patients on hemodialysis. Efficacy of antibiotic prophylaxis. N. Engl. J. Med. 1986;315:91–96. - PubMed
    1. Nguyen MH, et al. Nasal carriage of and infection with Staphylococcus aureus in HIV-infected patients. Ann. Intern. Med. 1999;130:221–225. - PubMed

Publication types