Clinical Trial
. 2004 Dec;101(6):960-9.
doi: 10.3171/jns.2004.101.6.0960.

Intraoperative infrared imaging of brain tumors

Affiliations
Clinical Trial

Intraoperative infrared imaging of brain tumors

Alexander M Gorbach et al. J Neurosurg. 2004 Dec.

Abstract

Object: Although clinical imaging defines the anatomical relationship between a brain tumor and the surrounding brain and neurological deficits indicate the neurophysiological consequences of the tumor, the effect of a brain tumor on vascular physiology is less clear.

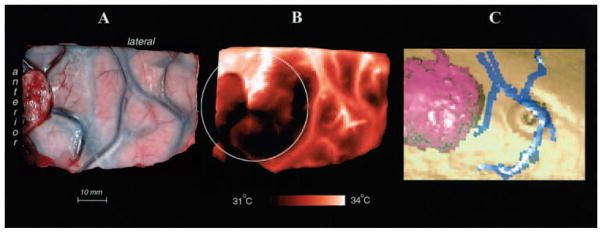
Methods: An infrared camera was used to measure the temperature of the cortical surface before, during, and after removal of a mass in 34 patients (primary brain tumor in 21 patients, brain metastases in 10 and falx meningioma, cavernous angioma, and radiation necrosis-astrocytosis in one patient each). To establish the magnitude of the effect on blood flow induced by the tumor, the images were compared with those from a group of six patients who underwent temporal lobectomy for epilepsy. In four cases a cerebral artery was temporarily occluded during the course of the surgery and infrared emissions from the cortex before and after occlusion were compared to establish the relationship of local temperature to regional blood flow. Discrete temperature gradients were associated with surgically verified lesions in all cases. Depending on the type of tumor, the cortex overlying the tumor was either colder or warmer than the surrounding cortex. Spatial reorganization of thermal gradients was observed after tumor resection. Temperature gradients of the cortex in patients with tumors exceeded those measured in the cortex of patients who underwent epilepsy surgery.

Conclusions: Brain tumors induce changes in cerebral blood flow (CBF) in the cortex, which can be made visible by performing infrared imaging during cranial surgery. A reduction in CBF beyond the tumor margin improves after removal of the lesion.


Figures

Fig. 1
Fig. 1
Intraoperative infrared (IR) images of the dura mater (B) and the exposed cortex (D) of a patient with metastatic melanoma in the parietal lobe of the right hemisphere. Visible-light images of the dura mater (A) and cortex (C) are provided for a comparison. Multiple cortical vessels (C) can be seen through the dura mater on an infrared image (B), as can some dural vessels (A) and (B). Note the temperature difference between the superficial cortical arteries and veins (C and D).
Fig. 2
Fig. 2
A and B: Comparison of a cortical infrared image (B) with a visible-light image (A) obtained before resection of a colon carcinoma that had metastasized to the right frontal area. C: A 3D reconstruction made from a preoperative contrast-enhanced MR image demonstrating the tumor (purple) and surface veins (blue). This image was obtained to project the tumor’s border on the cortical surface (circle in B).
Fig. 3
Fig. 3
A–C: Infrared image of the cortex (A) obtained in a patient with an oligodendroglioma in the right frontal operculum, revealing a steep local decrease of temperature (hypothermia) at the site of the tumor (dark area; central mass of the tumor is at the intersection of the yellow and purple arrows). Corresponding visible-light image (B) and temperature profiles (C) are presented. D–F: Infrared image of the cortex in a patient with an astrocytoma (D) demonstrating a localized increase in the temperature (hyperthermia) at the site of the tumor (bright area with a central mass of the tumor at the intersection of the yellow and purple arrows). Corresponding visible-light image (E) and temperature profiles (F) are presented. The horizontal (yellow) and vertical (purple) temperature profiles show pixel values along the yellow and purple arrows in the infrared images. The visible-light images of the cortex in the patients are presented for orientation.
Fig. 4
Fig. 4
Bar graph showing the normalized difference between the temperature of the cortex overlying the tumor and the minimum temperature at the cortex (ΔT1) for groups of patients with oligodendroglioma, cerebral metastasis from melanoma, and GBM. The normalized difference between the tumor and minimum temperatures is larger in the metastatic disease group than in the oligodendroglioma (p = 0.001) and GBM (p = 0.01) groups.
Fig. 5
Fig. 5
Upper: Cortical temperatures during occlusion and reperfusion of a single vessel. A: A visible-light image. A vessel with a 0.9-mm diameter, which was located in the area of a superficial tumor (GBM) was chosen for a temporary (14.7-second) occlusion. B–E: Four representative infrared images were chosen from 90 images that were obtained (350 msec/image) and represent temperature changes 0.35 seconds before clipping (B), 1.4 seconds after clipping (C), 0.35 seconds before reperfusion (D), and 12.9 seconds after reperfusion (E); a diminishing number of bright cortical vessels can be seen after occlusion. Note the difference in the rate of temperature decline on the temperature profiles (temperature changes in relative value) from ROIs in the brain parenchyma (G) and vessel (H). Note also the ROIs close to the clipping site (G and H) and those at a distance of 40 mm (K) and 70 mm (I and J), which display changes in temperature, although other cortical sites (F) do not. Two small arrows (J) show the start and end of the occlusion. Note the inverse temperature changes in J and K and the different rates of change in G and J during occlusion but not during reperfusion. Lower: Views in which subtraction was used to enhance the capacity to make visible the changes in individual vessels and their distribution after proximal vessel occlusion. The images demonstrate infrared image enhancement during the occlusion and reperfusion of a single vessel (see upper panel). Images B′, C′, D′, and E′ are the result of a normalized subtraction of a baseline image (collected 0.7 seconds before clipping; not shown here) from representative infrared images (B, C, D, and E in upper panel). Note the difference between C′ and D′ in the vascular territories involved. Note that the image in B′ is not black because its represents subtraction of two images collected at slightly different phases of the cardiac cycle.
Fig. 6
Fig. 6
Cortical temperature changes associated with evaporation of saline. The cortical infrared images were obtained 1 second before (A), during (B), and 35 seconds after application of vaporized saline (C). Regions of interest (5 × 5 pixels) are marked in the tumor area (red square) and normal cortex (yellow square) on the infrared image (D; the image is an enlargement of that shown in C). A temperature profile (E) was extracted from 100 images (obtained in 1 second) acquired during a 2-second saline irrigation (downward pointing arrow indicates the start and upward pointing arrow indicates the end of the irrigation). Note the difference in temperature recovery between the tumor area (red line in graph) and the normal cortex (yellow line in graph) after evaporative cooling.
Fig. 7
Fig. 7
Reorganization of cortical temperature gradients after tumor resection. A and B: Cortical infrared images obtained before (A) and after (B) resection of a low-grade oligodendroglioma. Straight lines (solid red line in A and solid blue line in B) were placed on infrared images passing through the tumor center and its projection on the cortex. Two temperature profiles—before tumor resection (C) and after it (D)—reflect temperature changes along the solid red line in A and the solid blue line in B. Note that far from the area of resection, multiple cortical sites and vessels previously invisible on the preresection infrared image (A) are now seen on the postresection infrared image (B). After resection, the brain tissue adjacent to the tumor bed is cooler than the surrounding brain (arrows in B and D).

References

    1. Anbar M, Brown C, Milescu L, et al. The potential of dynamic area telethermometry in assessing breast cancer. IEEE Eng Med Biol Mag. 2000;19:58–62. - PubMed
    1. Behrens PF, Ostertag CB, Warnke PC. Regional cerebral blood flow in peritumoral brain edema during dexamethasone treatment: a xenon-enhanced computed tomographic study. Neurosurgery. 1998;43:235–241. - PubMed
    1. Capon A, Hildebrand J, Verbist A, et al. Changes in regional cerebral blood flows produced by dexamethasone in patients with brain metastases. Acta Neurol Belg. 1976;76:325–330. - PubMed
    1. DeLaPaz RL, Patronas NJ, Brooks RA, et al. Positron emission tomographic study of suppression of gray-matter glucose utilization by brain tumors. AJNR. 1983;4:826–829. - PMC - PubMed
    1. Di Chiro G, DeLaPaz RL, Brooks RA, et al. Glucose utilization of cerebral gliomas measured by [18F] fluorodeoxyglucose and positron emission tomography. Neurology. 1982;32:1323–1329. - PubMed

MeSH terms