. 2005 Jan 18;102(3):524-9.
doi: 10.1073/pnas.0408311101. Epub 2004 Dec 15.

Microstimulation of the superior colliculus focuses attention without moving the eyes

Affiliations

Microstimulation of the superior colliculus focuses attention without moving the eyes

James R Müller et al. Proc Natl Acad Sci U S A. .

Abstract

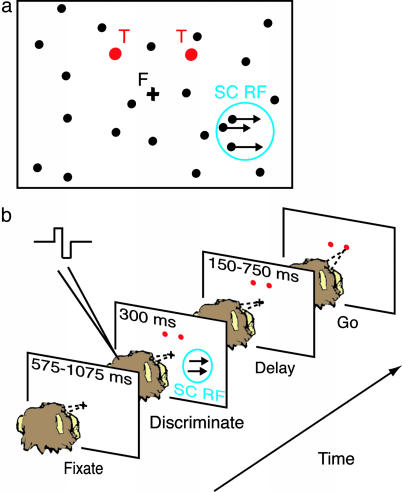
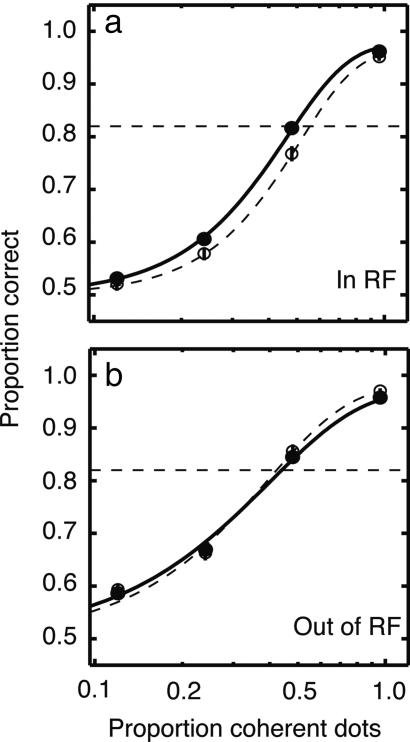
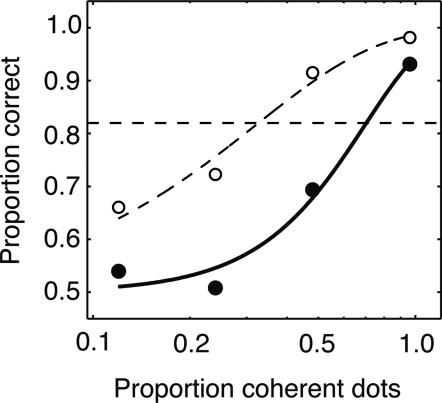
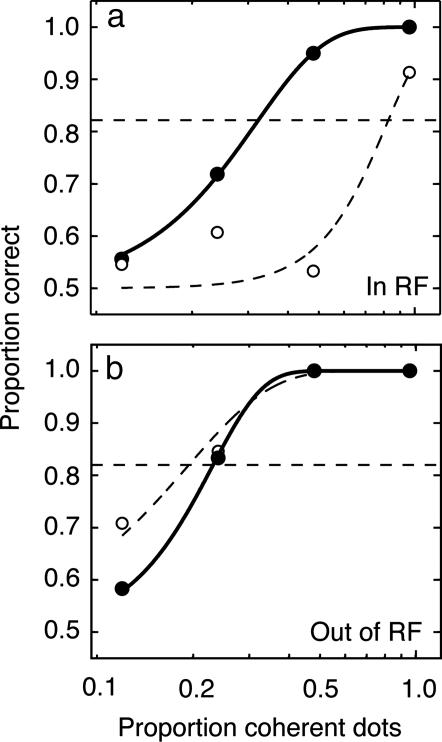
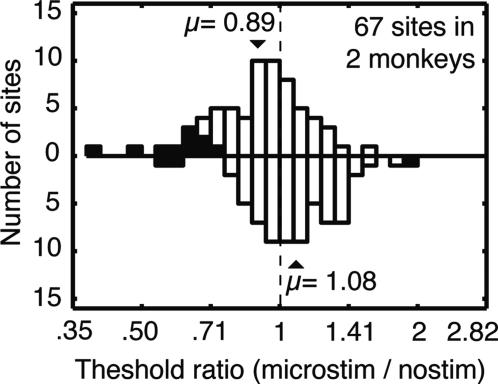
The superior colliculus (SC) is part of a network of brain areas that directs saccadic eye movements, overtly shifting both gaze and attention from position to position, in space. Here, we seek direct evidence that the SC also contributes to the control of covert spatial attention, a process that focuses attention on a region of space different from the point of gaze. While requiring monkeys to keep their gaze fixed, we tested whether microstimulation of a specific location in the SC spatial map would enhance visual performance at the corresponding region of space, a diagnostic measure of covert attention. We find that microstimulation improves performance in a spatially selective manner: thresholds decrease at the location in visual space represented by the stimulated SC site, but not at a control location in the opposite hemifield. Our data provide direct evidence that the SC contributes to the control of covert spatial attention.


Figures

Fig. 1.
Fig. 1.
Direction discrimination task used to measure spatial attention. (a) Spatial arrangement of fixation cross (F), coherently moving dots (arrows), flickering distracter dots (black circles), response targets (T, red circles), and SC topographic location (blue circle) for the test condition. The stimulus aperture was square, and the width and height of the stimulus aperture were set to one-half its distance from fixation. The aperture was always centered on the SC response field. Because coherent motion always flowed rightward or leftward in these experiments, the square aperture could not induce artifactual motion signals at its edges (i.e., the barberpole illusion). (b) Sequence of trial events. The monkey was required to fixate throughout the trial. Disappearance of the fixation point cued the monkey to make an eye movement to one of the response targets, corresponding to the perceived direction of motion. Microstimulation overlapped in time with the coherent motion signal (see Methods).
Fig. 4.
Fig. 4.
Average psychometric function obtained during 64 of our 67 experiments (those during which we measured performance at exactly the same family of four coherences). Each data point is the average proportion correct across 64 experiments. Error bars (often smaller than the symbols, average 0.011) indicate ±1 SEM. Filled and open symbols and solid and dashed curves correspond to trials with and without electrical stimulation, respectively. (a) Average performance when coherent motion was at the location represented by the SC stimulation site. Psychometric functions fit to these average data indicate that threshold is significantly reduced from 51% to 46% coherence (bootstrap test, P < 0.01). (b) Performance when coherent motion was at the control location. Threshold was not reduced (bootstrap test, P > 0.7).
Fig. 2.
Fig. 2.
Psychometric functions describing direction discrimination performance with distracters (filled circles, solid traces) and without (open circles, dashed traces). The proportion of correct decisions is plotted against the strength of the motion signal. Threshold performance (82% correct, dashed horizontal line) was computed from the fitted curves (see Methods).
Fig. 3.
Fig. 3.
Psychometric functions obtained during study of a single SC site. Filled and open symbols and solid and dashed curves correspond to trials with and without electrical stimulation, respectively. (a) Performance when coherent motion was at the location represented by the SC stimulation site. Psychophysical threshold was significantly reduced from 82% to 32% coherence (bootstrap test, P < 0.01). (b) Performance when coherent motion was at the control location. Threshold was not reduced (bootstrap test, P > 0.7).
Fig. 5.
Fig. 5.
Frequency histogram showing changes in motion discrimination threshold (as ratios) induced by microstimulation at each of 67 sites in two monkeys. Upward directed bars illustrate data obtained with the coherent motion at the location corresponding to the SC stimulation site. Downward bars illustrate data from the control location. Statistically significant changes in threshold are indicated by filled bars. Arrows indicate average changes for each condition (computed from the log2 threshold change ratios). The dashed vertical line indicates thresholds that are unchanged (ratio 1). Electrical stimulation at this population of SC sites reduced thresholds significantly and selectively.

Comment in

  • Biography of William T. Newsome.
    Hitt E. Hitt E. Proc Natl Acad Sci U S A. 2005 Jan 18;102(3):521-3. doi: 10.1073/pnas.0409116102. Epub 2005 Jan 12. Proc Natl Acad Sci U S A. 2005. PMID: 15647353 Free PMC article. No abstract available.

References

    1. Ferrier, D. (1890) Cerebral Localisation (Smith, Elder and Co., London).
    1. Rizzolatti, G., Riggio, L., Dascola, I. & Umilta, C. (1987) Neuropsychologia 25, 31-40. - PubMed
    1. Kowler, E., Anderson, E., Dosher, B. & Blaser, E. (1995) Vision Res. 35, 1897-1916. - PubMed
    1. Sperling, G. & Melchner, M. J. (1978) Science 202, 315-318. - PubMed
    1. Hoffman, J. E. & Subramaniam, B. (1995) Percept. Psychophys. 57, 787-795. - PubMed

Publication types