Comparative Study
. 2004 Dec 15;18(24):3094-105.
doi: 10.1101/gad.1246404.

Coordination of replication and transcription along a Drosophila chromosome

Affiliations
Comparative Study

Coordination of replication and transcription along a Drosophila chromosome

David M MacAlpine et al. Genes Dev. .

Abstract

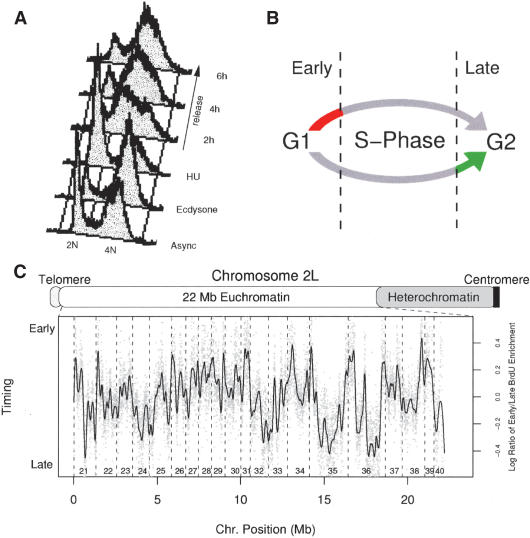
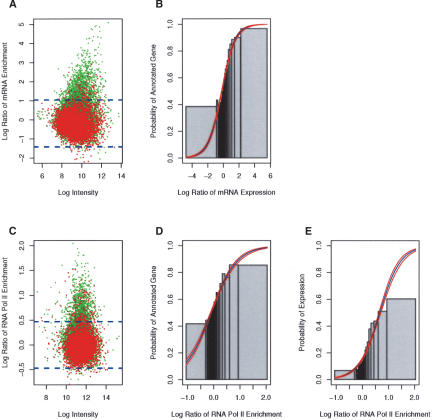
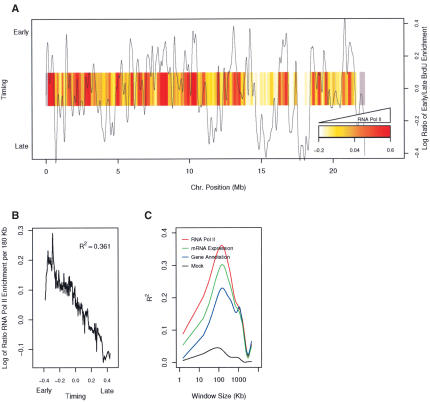
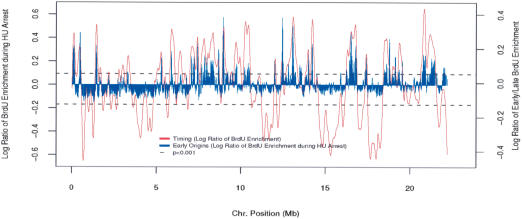
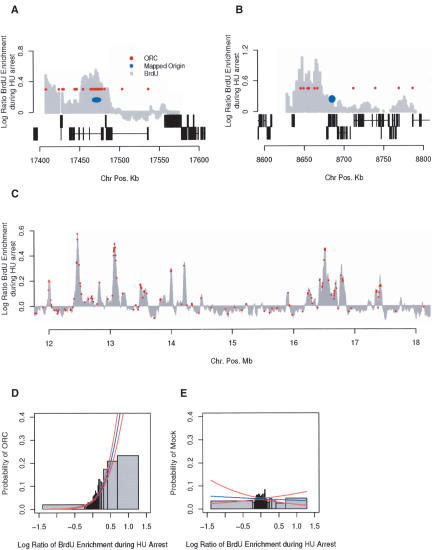
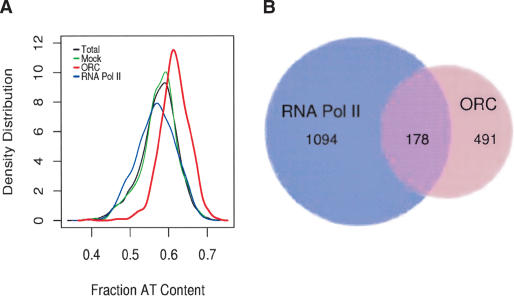
The mechanisms by which metazoan origins of DNA replication are defined, regulated, and influenced by chromosomal events remain poorly understood. To gain insights into these mechanisms, we developed a systematic approach using a Drosophila high-resolution genomic microarray to determine replication timing, identify replication origins, and map protein-binding sites along a chromosome arm. We identify a defined temporal pattern of replication that correlates with the density of active transcription. These data indicate that the influence of transcription status on replication timing is exerted over large domains (>100 kb) rather than at the level of individual genes. We identify 62 early activating replication origins across the chromosome by mapping sites of nucleotide incorporation during hydroxyurea arrest. Using genome-wide location analysis, we demonstrate that the origin recognition complex (ORC) is localized to specific chromosomal sites, many of which coincide with early activating origins. The molecular attributes of ORC-binding sites include increased AT-content and association with a subset of RNA Pol II-binding sites. Based on these findings, we suggest that the distribution of transcription along the chromosome acts locally to influence origin selection and globally to regulate origin activation.


Figures

Figure 1.
Figure 1.
Replication timing profile for chromosome 2L. (A) FACS profile of Drosophila Kc cell synchronization. Asynchronous log-phase Kc cells were treated with the molting hormone Ecdysone to arrest the cells at G2. Following 18-20 h, the cells were washed and resuspended in fresh medium containing HU. The cells accumulated at the G1/S transition within 12 h. Following release from HU, the cells proceeded through S phase. (B) Early and late-replicating sequences were specifically labeled using BrdU. Early or late-replicating sequences were labeled with a 1-h pulse at the beginning or end of S phase, respectively. The BrdU containing DNAs were enriched by immunoprecipitation and differentially labeled with Cy5- or Cy3-conjugated dUTP. (C) Replication timing was determined for each of the 11,243 unique euchromatic sites on chromosome 2L (gray dots) as the ratio of early to late BrdU incorporating sequences. The replication timing profile (black line) was generated by applying a smoothing algorithm to the raw timing data. The numbered cytological intervals of the chromosome are indicated at the bottom.
Figure 2.
Figure 2.
Analysis of the transcriptome in Kc cells. (A) mRNA expression along the array matches the chromosome annotation (Celniker and Rubin 2003). A scatter plot of the mean log ratio of mRNA expression versus the average log intensity of each site on the array. The red and green spots indicate intergenic and intragenic sites on the array, respectively. A site was scored intragenic if it had any overlap with an annotated gene. The dashed blue line represents the confidence level (p < 0.01) of the enrichment. Note, that the majority (>85%) of enriched sites overlap with the annotated genes. (B) Probability of an annotated transcript increases with mRNA expression levels. Logistic regression was used to model the probability of a site being annotated as a gene as a function of mRNA expression. The blue and red lines represent the modeled probability and confidence levels, respectively. The Likelihood Ratio (L.R. = 1511) is a “goodness of fit” test statistic comparing the fit of the modeled data to the fit of the null model. The L.R. has a χ2 distribution with one degree of freedom. The fitted model is significantly (p < 10-16) different from the null hypothesis. For comparison, the raw data was ordered by mRNA expression and sorted into bins of 200 (gray bars). The height of the gray bars is the fraction of annotated genes in each of the bins. The width of the bar represents the range of mRNA expression for each bin. (C) RNA Pol II enrichment matches the chromosome annotation. See above for details. (D) Same as B, except using RNA Pol II (L.R. = 798, p < 10-16). (E) Logistic regression modeling the probability a site is expressed (determined from mRNA enrichment) as a function of RNA Pol II enrichment (L.R. = 1288, p < 10-16).
Figure 3.
Figure 3.
Replication timing correlates with the transcription profile of the chromosome. (A) RNA Pol II density delineates early and late-replicating domains. Spatial plot of the moving average (n = 100) of RNA Pol II enrichment along the chromosome, represented as a heat map (red, most dense; white, least dense). The gray regions on either end of the chromosome represent regions with insufficient data for the moving average. The smoothed timing data was plotted as black curve. (B) Actively transcribed regions replicate early. The moving average (n = 100) of RNA Pol II enrichment using windows of 180 Kb plotted as a function of replication timing. An R2-value of 0.361 was calculated for the correlation (without using a moving average). (C) Transcription over large domains influences replication timing. An R2-value was calculated for the correlation between replication timing and the density of either RNA Pol II (red), gene expression (green), annotated genes (blue), or a mock immunoprecipitation (black) using windows of increasing sequence.
Figure 4.
Figure 4.
Identification and mapping of HU-resistant early replication origins. Early origins were identified by releasing cells synchronized at G2 into medium containing HU and BrdU. Only those sequences immediately adjacent to replication origins are expected to incorporate BrdU. The blue histogram represents BrdU enrichment along the chromosome. The replication timing profile is overlaid in red. Early BrdU-enriched peaks above the dashed black line (p < 0.001) are significantly enriched.
Figure 5.
Figure 5.
Identification of ORC-binding sites. (A) Replication of the DNA Pol α locus on chromosome 3R. The gray histogram represents sites of BrdU incorporation during HU arrest (early activating origins), the red circles represent ORC-binding sites, and the blue oval represents a zone of replication initiation previously mapped by two-dimensional gel electrophoresis (Shinomiya and Ina 1994). The gene structure for both the Watson and Crick strands for 130 kb surrounding the DNA Pol α locus is depicted below the histogram. Exons are indicated as black boxes connected by a horizontal black line. (B) Replication of the chorion locus on chromosome 3L. (C) A total of 491 ORC-binding sites were identified on chromosome 2L by genome-wide location analysis. A subset of ORC-binding sites are shown in red overlaid on a portion (6 Mb) of the early activating origins (gray histogram). The ORC-binding sites represent <5% of the analyzed data points. (D) The probability of finding ORC associated with the DNA increases with BrdU enrichment at early origins. Logistic regression was used to model the probability of a sequence being associated with ORC as a function of BrdU enrichment during HU-arrest (L.R. = 265, p < 10-16). (E) Same as D, but using 491 sites from a mock immunoprecipitation (L.R. = 0.08, p < 0.777).
Figure 6.
Figure 6.
Molecular predictors of ORC localization. (A) ORC preferentially binds AT-rich regions of the genome. The density distribution of AT-content is shown for ORC-binding sites. The mean AT-ratio of ORC-associated array sequences was 62% compared with 57% for the all of the fragments on the array (t = 24.23, p < 10-16). The frequency distribution of AT-content for a mock ChIP (green), and RNA Pol II (blue) were statistically indistinguishable from that of the entire array (black). (B) ORC-binding sites colocalize with a subset of RNA Pol II sites. A Venn diagram depicting the overlap of RNA Pol II and ORC-binding sites along the chromosome. The degree of overlap was highly significant (χ2 = 357 and p < 10-16).

References

    1. Abdurashidova G., Deganuto, M., Klima, R., Riva, S., Biamonti, G., Giacca, M., and Falaschi, A. 2000. Start sites of bidirectional DNA synthesis at the human lamin B2 origin. Science 287: 2023-2026. - PubMed
    1. Aladjem M., Groudine, M., Brody, L., Dieken, E., Fournier, R., Wahl, G., and Epner, E. 1995. Participation of the human β-globin locus control region in initiation of DNA replication. Science 270: 815-819. - PubMed
    1. Anglana M., Apiou, F., Bensimon, A., and Debatisse, M. 2003. Dynamics of DNA replication in mammalian somatic cells: Nucleotide pool modulates origin choice and interorigin spacing. Cell 114: 385-394. - PubMed
    1. Austin R., Orr-Weaver, T., and Bell, S. 1999. Drosophila ORC specifically binds to ACE3, an origin of DNA replication control element. Genes & Dev. 13: 2639-2649. - PMC - PubMed
    1. Beall E., Manak, J., Zhou, S., Bell, M., Lipsick, J., and Botchan, M. 2002. Role for a Drosophila Myb-containing protein complex in site-specific DNA replication. Nature 420: 833-837. - PubMed

Publication types

LinkOut - more resources