. 2005 Feb;16(2):964-75.
doi: 10.1091/mbc.e04-09-0774. Epub 2004 Dec 15.

A dynamic actin cytoskeleton functions at multiple stages of clathrin-mediated endocytosis

Affiliations

A dynamic actin cytoskeleton functions at multiple stages of clathrin-mediated endocytosis

Defne Yarar et al. Mol Biol Cell. 2005 Feb.

Abstract

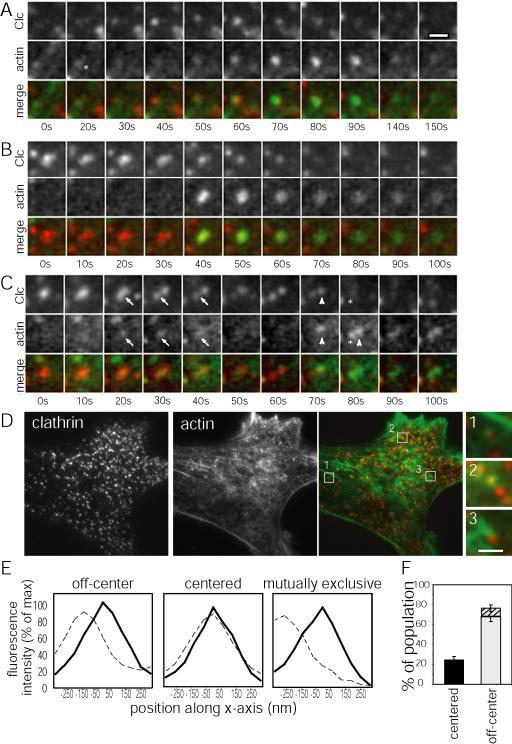
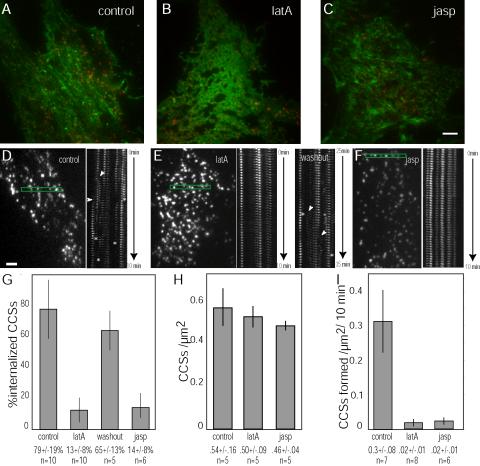
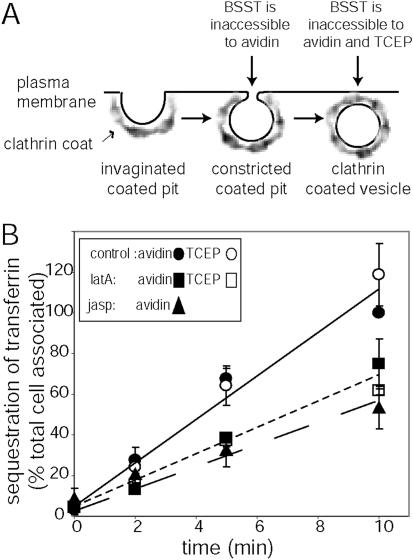
Clathrin-mediated endocytosis in mammalian cells is critical for a variety of cellular processes including nutrient uptake and cell surface receptor down-regulation. Despite the findings that numerous endocytic accessory proteins directly or indirectly regulate actin dynamics and that actin assembly is spatially and temporally coordinated with endocytosis, direct functional evidence for a role of actin during clathrin-coated vesicle formation is lacking. Here, we take parallel biochemical and microscopic approaches to address the contribution of actin polymerization/depolymerization dynamics to clathrin-mediated endocytosis. When measured using live-cell fluorescence microscopy, disruption of the F-actin assembly and disassembly cycle with latrunculin A or jasplakinolide results in near complete cessation of all aspects of clathrin-coated structure (CCS) dynamics. Stage-specific biochemical assays and quantitative fluorescence and electron microscopic analyses establish that F-actin dynamics are required for multiple distinct stages of clathrin-coated vesicle formation, including coated pit formation, constriction, and internalization. In addition, F-actin dynamics are required for observed diverse CCS behaviors, including splitting of CCSs from larger CCSs, merging of CCSs, and lateral mobility on the cell surface. Our results demonstrate a key role for actin during clathrin-mediated endocytosis in mammalian cells.


Figures

Figure 1.
Figure 1.
Assembled clathrin exhibits diverse behaviors. Images from time-lapse sequences showing the behavior of CLC-DsRed. TIR-FM (top panels) and WF-EFM (bottom panels). (A) Formation and internalization of CCV, Supplementary Video 1, (B) splitting and internalization of a CCV from a larger CCS, Supplementary Video 2, and (C) merging/coalescing of CCS with other CCS, Supplementary Video 3. Structures of interest are marked by arrows. Evanescent field depth ∼100 nm. Scale bar, 1 μm.
Figure 2.
Figure 2.
Actin and clathrin associate during endocytosis. Images from time-lapse sequences showing the behaviors of CLC-DsRed and Oregon Green actin. TIR-FM CLC-DsRed (upper panels), corresponding Oregon Green actin colocalization (middle panels), and merged images (lower panels). (A) Formation and internalization of a single CCS, Supplementary Video 4, (B) internalization of a large CCS, Supplementary Video 5, and (C) splitting and internalization of CCSs, Supplementary Video 6. Asterisk in A marks site of actin and clathrin colocalization early in CME. Actin is recruited to the site of separating CCSs (arrow in C) and then sequentially to the CCSs as they become internalized (first arrowhead, then asterisk in C). Scale bar, 1 μm. (D) TIR-FM images of fixed Swiss 3T3 CLC-DsRed cells stained with Alexa-488 phalloidin. CLC-DsRed (right), Alexa-488 phalloidin–labeled F-actin (center), merge (CLC is red, F-actin is green). Regions showing examples of (1) off-center, (2) centered, or (3) mutually exclusive CCSs are marked in the merge image and corresponding images are presented at the right. Scale bar, 5 μm. (E) Examples of average fluorescence intensity along line-scan of CLC-DsRed (solid) and F-actin (dashed) structures that are either off-center, centered, or mutually exclusive. x-axis shown in nm and centered around the peak of clathrin intensity. Measured from CCSs in fixed cells, stained with Alexa-488 phalloidin and imaged with TIR-FM. (F) Histogram showing the average percentage ± SE of the mean of CCSs and corresponding actin foci that are centered (black bar), off-center (gray bar), or off-center and mutually exclusive (hatched bar).
Figure 3.
Figure 3.
Clathrin dynamics are perturbed after disruption of actin assembly/disassembly dynamics. (A–C) Merged TIR-FM images of Oregon Green actin (green) and CLC-DsRed (red) in (A) control cells, and cells treated with (B) 5 μM latA or (C) 1 μM jasp. Scale bar is 5 μm. (D–F) Images and corresponding kymographs of rectangular regions shown in (D) control, (E) latA- and washout, and (F) jasp-treated cells. Scale bar, 2 μm and time course shown in kymograph is 10 min. Kymographs were generated by extracting the rectangular region highlighted in the micrograph of each image in the time-lapse, and assembling the regions series side-by-side in chronological order into a montage. Internalization events are marked by asterisks and formation of CCSs are marked by arrowheads. See Supplementary Video 7. (G–I) Histograms showing the effects of latA and jasp on (G) % of CCSs internalized during a 10-min internal, (H) the average surface density of CCSs, and (I) number of CCSs formed per μm2 during a 10-min interval. n = number of cells analyzed per condition. Data shown are average ± SE of the mean.
Figure 4.
Figure 4.
Lateral motility of CCSs requires a dynamic actin cytoskeleton. (A) TIR-FM images of CCSs and paths that structures followed in a 20-s interval in control, latA-, and jasp-treated cells. (B) Actin recruitment behind a motile CCS, indicated by arrow. See Supplementary Video 8. Scale bar, 1 μm. (C) Box plots showing the range of average path length that CCSs moved in 20-s intervals in control, latA-, and jasp-treated cells. Outliers shown as circles. Averages ± SE of the mean are shown below box plots. n = 63–93 CCS from three to four cells per condition.
Figure 5.
Figure 5.
Transferrin internalization is partially inhibited at an intermediate stage of CCV formation after disruption of F-actin cytoskeletal dynamics. (A) Schematic describing the stage specific biochemical assay used. Biotinylated transferrin (BSST) is sequestered from avidin in constricted CCPs and from avidin and TCEP in sealed coated vesicles. (B) Time-course of transferrin sequestration from either avidin (black symbols) or TCEP (white symbols) in control (•, ○), latA-(▪, □), or jasp (▴)-treated cells. Data are expressed as the percent of the total cell surface associated BSST (average ± SD of the mean). Data from at least three independent experiments.
Figure 6.
Figure 6.
Clathrin-coated pit morphology is altered after disruption of actin cytoskeletal dynamics. (A) Electron micrographs of representative classifications of CCSs. Image containing clustered CCS (cl, electron-dense coats marked by asterisks) also contains curved CCS (cv). Scale bar, 250 nm. (B) Histogram showing the percentage of CCSs in each morphology classification (shown schematically below bars, white-shallow, light gray-curved, dark gray-deeply invaginated, black-vesicle). CCSs found to be located at top of cells (solid bar), CCSs located at bottom of cells (hatched bars). n = number of CCSs counted per condition.
Figure 7.
Figure 7.
Model showing the requirement for F-actin dynamics in CME. F-actin assembly/disassembly dynamics are required for (1) CCS assembly, (2) CCS motility, (3) CCS constriction, and possibly (4) scission to form a CCV and (5) translocation of the nascent vesicle away from the plasma membrane. CCS invagination proceeds in the absence of actin dynamics. Actin assembly may proceed from the edge of the CCS and assemble inwards, facilitating CCS constriction, scission, and translocation.

Similar articles

Cited by

References

    1. Ayscough, K. R. (2000). Endocytosis and the development of cell polarity in yeast require a dynamic F-actin cytoskeleton. Curr. Biol. 10, 1587-1590. - PubMed
    1. Axelrod, D. (2001). Total internal reflection fluorescence microscopy in cell biology. Traffic 2, 764-774. - PubMed
    1. Bennett, E. M., Chen, C. Y., Engqvist-Goldstein, A. E., Drubin, D. G., and Brodsky, F. M. (2001). Clathrin hub expression dissociates the actin-binding protein Hip1R from coated pits and disrupts their alignment with the actin cytoskeleton. Traffic 2, 851-858. - PubMed
    1. Bubb, M. R., Senderowicz, A. M., Sausville, E. A., Duncan, K. L., and Korn, E. D. (1994). Jasplakinolide, a cytotoxic natural product, induces actin polymerization and competitively inhibits the binding of phalloidin to F-actin. J. Biol. Chem. 269, 14869-14871. - PubMed
    1. Carter, L. L., Redelmeier, T. E., Woollenweber, L. A., and Schmid, S. L. (1993). Multiple GTP-binding proteins participate in clathrin-coated vesicle-mediated endocytosis. J. Cell Biol. 120, 37-45. - PMC - PubMed

Publication types

MeSH terms

LinkOut - more resources