

Transmissibility of 1918 pandemic influenza
- PMID: 15602562
- PMCID: PMC7095078
- DOI: 10.1038/nature03063
Transmissibility of 1918 pandemic influenza
Abstract
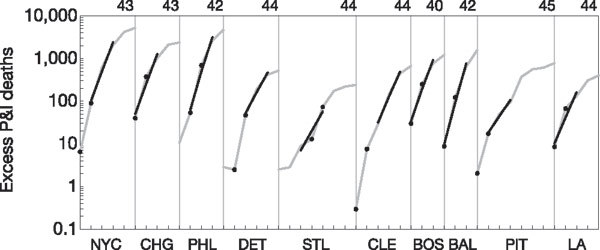
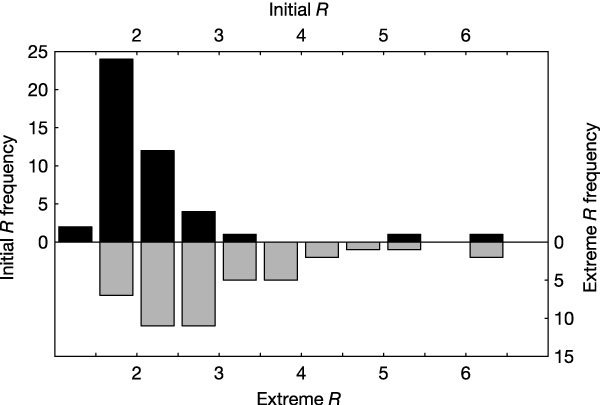
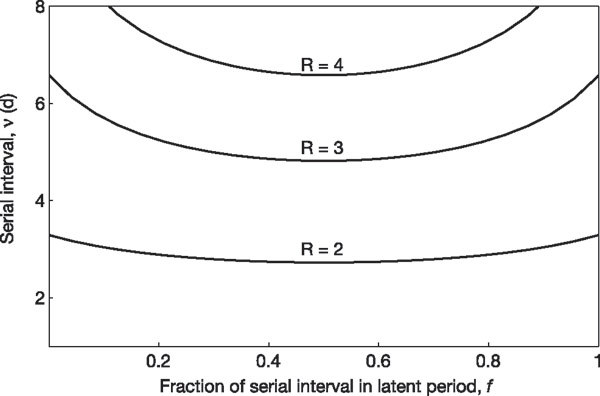
The 1918 influenza pandemic killed 20-40 million people worldwide, and is seen as a worst-case scenario for pandemic planning. Like other pandemic influenza strains, the 1918 A/H1N1 strain spread extremely rapidly. A measure of transmissibility and of the stringency of control measures required to stop an epidemic is the reproductive number, which is the number of secondary cases produced by each primary case. Here we obtained an estimate of the reproductive number for 1918 influenza by fitting a deterministic SEIR (susceptible-exposed-infectious-recovered) model to pneumonia and influenza death epidemic curves from 45 US cities: the median value is less than three. The estimated proportion of the population with A/H1N1 immunity before September 1918 implies a median basic reproductive number of less than four. These results strongly suggest that the reproductive number for 1918 pandemic influenza is not large relative to many other infectious diseases. In theory, a similar novel influenza subtype could be controlled. But because influenza is frequently transmitted before a specific diagnosis is possible and there is a dearth of global antiviral and vaccine stores, aggressive transmission reducing measures will probably be required.
Conflict of interest statement
The authors declare that they have no competing financial interests.
Figures
Comment in
-
Infectious disease: past and future of an old foe.Nature. 2004 Dec 16;432(7019):817. doi: 10.1038/432817b. Nature. 2004. PMID: 15602541 No abstract available.
References
-
- Patterson KD, Pyle GF. The geography and mortality of the 1918 influenza pandemic. Bull. Hist. Med. 1991;65:4–21. - PubMed
-
- Anderson RM, May RM. Infectious Diseases of Humans: Dynamics and Control. 1991.
-
- Nicholson K, Webster RG, Hay AJ. Textbook of Influenza. 1998.
Publication types
MeSH terms
LinkOut - more resources
Full Text Sources
Other Literature Sources
