. 2005 May 1;105(9):3588-95.
doi: 10.1182/blood-2004-08-3251. Epub 2004 Dec 16.

Reversal of long-term sepsis-induced immunosuppression by dendritic cells

Affiliations

Reversal of long-term sepsis-induced immunosuppression by dendritic cells

Claudia F Benjamim et al. Blood. .

Abstract

Severe sepsis leads to long-term systemic and local immunosuppression, which is the cause of a number of complications, including pulmonary infection. A therapeutic strategy that reverses this immunosuppression is required, given the ongoing high mortality rate of patients who have survived a severe sepsis. The present study demonstrates that experimental severe sepsis renders the lung susceptible to a normally innocuous Aspergillus fumigatus fungus challenge, due to a dominant lung type 2 cytokine profile. Dendritic cells (DCs) obtained from the lungs of mice subjected to cecal ligation and puncture (CLP) model were skewed toward type 2 cytokine profile, which occurred with exaggerated expression of Toll-like receptor 2 (TLR2). The intrapulmonary transfer of bone marrow-derived DCs (BMDCs) in postseptic mice prevented fatal Aspergillus infection. This therapy reduced the overall inflammatory response and fungal growth in the lung, and promoted the balance of proinflammatory and suppressive cytokines in the lung. Thus, intrapulmonary DC supplementation appears to restore the pulmonary host response in the postseptic lung in our animal model. These data strongly suggest that lung DCs are profoundly affected as a consequence of the systemic impact of severe sepsis, and the identification of mechanisms that restore their function may serve as a key strategy to reverse sepsis-induced immunosuppression.


Figures

Figure 1.
Figure 1.
Survival curve, lung histopathology, and neutrophil migration of sham- or CLP-operated mice challenged or not with A fumigatus. (A) At day 15 after sham or CLP surgery, both groups of mice were challenged intratracheally with either saline or 5 × 10⁷ A fumigatus conidia, and mouse survival was analyzed up to 7 days after challenges. Each group contained 8 to 10 mice, and data are representative of 2 independent experiments. *P < .05 between sham + Asp and CLP + Asp. (B) Pulmonary inflammatory change after A fumigatus conidia challenge in sham (i,iii,v) and CLP (ii,iv,vi) groups. At day 15 after surgery, all mice were challenged via intratracheal injection with saline or 5 × 10⁷ conidia and were killed at day 2. The lung was collected and processed for histology. Paraffin-embedded lung sections were stained with H&E (i-ii) or GMS (iii-vi; fungal material appears black in lung sections [black dots]). Red arrows highlight dead conidia, while blue arrows highlight hyphae growth. Original magnification was × 20 for panels i-iv, and original magnification was × 100 for panels v-vi. (C) Sham and CLP surgery groups were intratracheally challenged with A fumigatus conidia at day 15 after surgery, and BAL was collected at 6 hours and 2 days after fungal challenge. The results shown are expressed as the percentage of neutrophils in the BAL, and each group contained 5 to 6 mice. The data are representative of 3 separate experiments, and are expressed as mean ± SEM. (D) Lung samples were obtained from sham- or CLP-operated mice challenged with either saline or 5 × 10⁷ A fumigatus conidia at day 2 after challenge. The tissue was processed for MPO protein concentration assay. The data are expressed as mean ± SEM; each group contained 10 to 12 mice.
Figure 2.
Figure 2.
Whole-lung IL-13, IL-4, TGF-β, and CCL2 levels in sham- and CLP-operated mice at day 15 after surgery. Whole-lung samples were collected at day 15 and homogenized, and cell-free supernatant was analyzed by specific ELISA. The data (expressed as mean ± SEM) shown are representative of 2 separate experiments, and each group contained 6 to 7 mice. *P < .05 between sham (□) and CLP (▪) groups.
Figure 3.
Figure 3.
Survival curve and lung histopathology from CLP-operated mice challenged with A fumigatus alone or coinjected with BMDCs. (A) At day 5 after CLP surgery, groups of mice were challenged intratracheally with either 5 × 10⁷ conidia alone or coinjected with BMDCs, and mouse survival was analyzed up to 7 days after A fumigatus challenge. Each group contained 5 mice. P < .05 between CLP + Asp and CLP + Asp + BDMC. (B) At day 15 after surgery, all mice were challenged via intratracheal injection with 5 × 10⁷ conidia alone (i) or together with 1 × 10⁶ BMDCs obtained from 15-day sham-operated mice (ii) or obtained from 15-day CLP mice (iii). The lungs were collected at day 10 after challenge and processed for histology. Paraffin-embedded lung sections were stained with GMS (fungal material appears black in lung sections [black dots]). Original magnification was × 20 for all panels.
Figure 4.
Figure 4.
Soluble levels of IL-12, TNF-α, IL-10, and IL-6 from purified lung DCs obtained on day 15 after sham or CLP surgery. (A) Mice were subjected to sham or CLP surgeries and killed on day 15, and whole lung samples were processed. Lung DCs were purified by positive selection with CD11c beads. Purified DCs were plated at a density of 2 × 10⁵/200 μL/well overnight, and then stimulated with medium, LPS (1 μg/mL), Pam3cys (25 μg/mL), SEA (100 μg/mL), or Aspergillus antigen (50 μg/mL) for 48 hours. Cell-free supernatants were collected, and IL-12, TNF-α, and IL-10 levels were measured by ELISA. (B) DCs were isolated and purified as described in panel A, and then cultured lung DCs were stimulated with medium, LPS (1 μg/mL), the legend regarding SEA (100 μg/mL), Aspergillus antigen (50 μg/mL), and Aspergillus conidia (1:1 ratio) and poli(I:C) (100 μg/mL) for 48 hours. Cell-free supernatants were collected and IL-6 level was measured by ELISA. Data are expressed as mean ± SEM. *P < .05 compared with the medium-treated group; #P < .05 compared with cytokine levels detected in cell-free supernatants from sham surgery lung DCs.
Figure 5.
Figure 5.
Different migration of GFP-BMDCs in mice subjected to CLP surgery. Mice received an intrathecal injection of 1 × 10⁶ GFP-DCs, and 24 hours later they were subjected to sham or CLP surgery. One day after, they were killed and the spleen, mesenteric and lung lymph nodes, lung, and BAL were collected and processed for flow cytometry analysis. Each value is a mean ± SEM of 3 to 4 mice, and the data are representative of 2 experiments. *P < .05 between sham and CLP groups; and #P < .05 between naive and CLP.
Figure 6.
Figure 6.
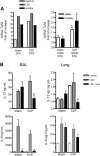
TLR2 expression on purified DCs or whole lungs from sham-operated and CLP mice and IL-12 and IL-6 levels on whole lung of sham-operated and CLP mice that received DC therapy during fungal challenge. (A) Left graph shows the mRNA for TLR2 on DCs purified from sham or CLP mice 15 days after surgery. The DCs were plated at 2 × 10⁵/200 μL, and, after resting, the cells were incubated with medium, LPS (1 μg/mL), or conidia (1:1) for 4 hours; cells were then harvested and the mRNA levels were evaluated by real-time PCR (Taqman). The right graph shows the mRNA TLR2 expression in whole lung of sham and CLP mice 15 days after surgery and 6 hours after challenge with saline or 5 × 10⁷ conidia. *P < .05 between sham and CLP groups. The data shown are representative of 2 experiments. (B) Groups of mice were subjected to sham or CLP surgery, and at day 15 they received an intratracheal injection of saline, 5 × 10⁷ conidia alone, or the same number of conidia plus 1 × 10⁶ BMDCs. At day 2 after the intratracheal challenge, mice were killed, and BAL and lung tissues were processed for ELISA analysis. The data shown are representative of 2 experiments. *P < .05 compared with CLP + Asp group, and #P < .05 compared with Sham + DC + asp and CLP + asp. Data are expressed as mean ± SEM.

References

    1. Romani L, Kaufmann SH. Immunity to fungi: editorial overview. Res Immunol. 1998;149: 277-281. - PubMed
    1. Pasare C, Medzhitov R. Toll-like receptors and acquired immunity. Semin Immunol. 2004;16: 23-26. - PubMed
    1. Riedemann NC, Guo RF, Ward PA. The enigma of sepsis. J Clin Invest. 2003;112: 460-467. - PMC - PubMed
    1. Beutler B, Poltorak A. Sepsis and evolution of the innate immune response. Crit Care Med. 2001;29: S2-S6; discussion S6-S7. - PubMed
    1. Cohen J. The immunopathogenesis of sepsis. Nature. 2002;420: 885-891. - PubMed

Publication types