

Coagulation profile and liver function in 102 patients after total cavopulmonary connection at mid term follow up
- PMID: 15604339
- PMCID: PMC1768627
- DOI: 10.1136/hrt.2003.026419
Coagulation profile and liver function in 102 patients after total cavopulmonary connection at mid term follow up
Abstract
Objective: To examine coagulation factors and liver function test abnormalities in patients after total cavopulmonary connection (TCPC).
Design: Cross sectional study comprising clinical and echocardiographic evaluation, and biochemical and coagulation profile screening.
Setting: Tertiary referral centre.
Methods: 102 patients aged 4-24 years (median 10 years) at one to eight years (median five years) after TCPC were examined. All patients were maintained on a low dose of aspirin. 96% of patients were in a good clinical condition (New York Heart Association class I or II). No intracardiac thrombi were detected on echocardiography and ventricular function was good in 91% of patients.
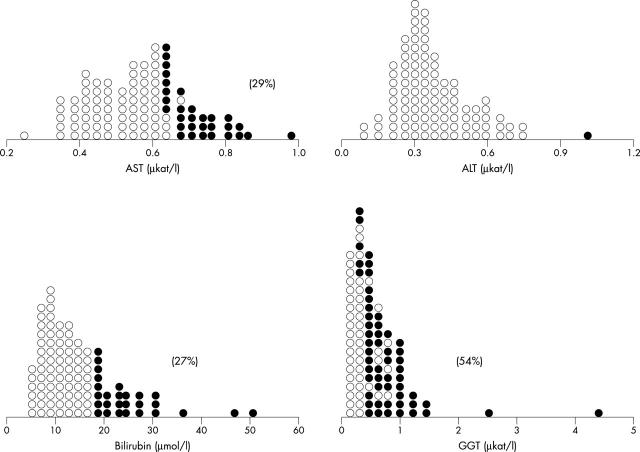
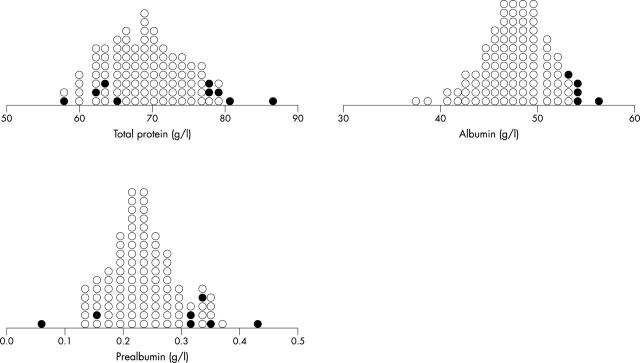
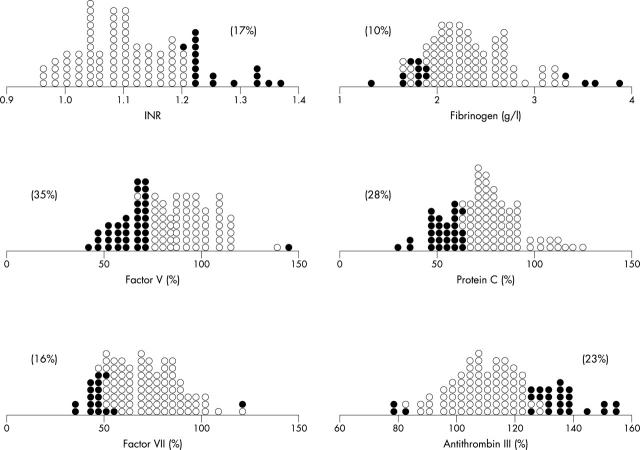
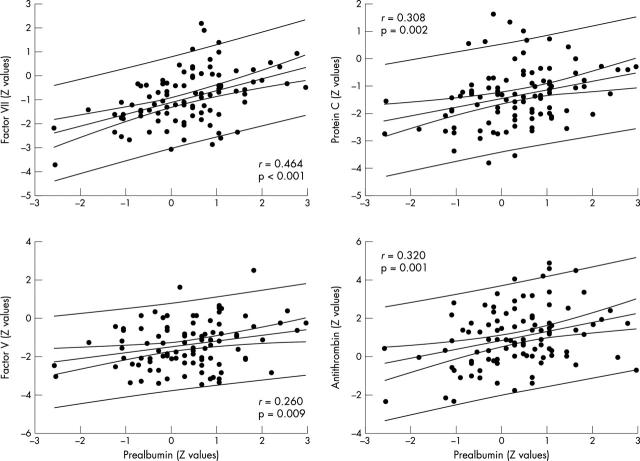
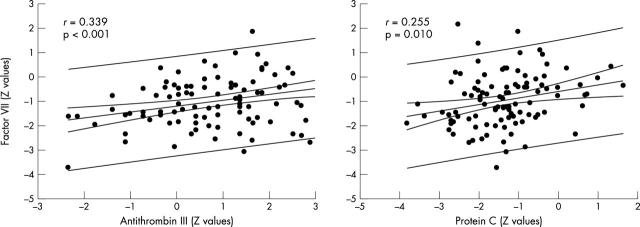
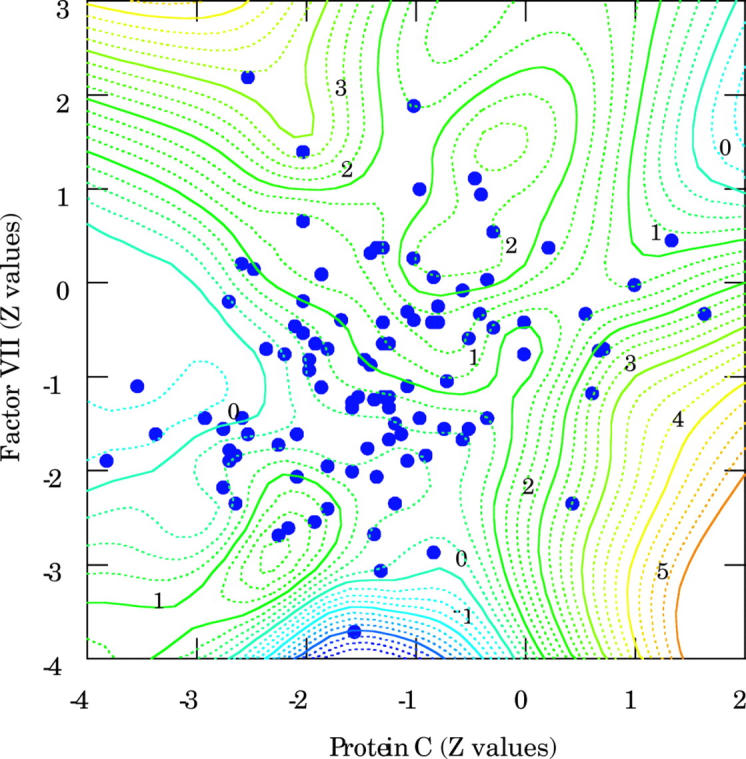
Results: Total bilirubin was increased in 27% and gamma glutamyltransferase in 54% of patients. Serum total protein, albumin, and prealbumin were normal in almost in all patients. Compared with the control group, patients after TCPC had significantly lower fibrinogen, factor V, factor VII, and protein C concentrations, prolonged international normalised ratio, and increased antithrombin III concentration. Factor V concentration was abnormally decreased in 35%, factor VII in 16%, and protein C in 28% of patients. Antithrombin III was increased in 23% of patients. Factor VII, factor V, protein C, and antithrombin III correlated significantly with serum prealbumin. There was also a significant correlation between procoagulant factor VII and both anticoagulant protein C and antithrombin III.
Conclusions: Almost half of patients after TCPC had laboratory signs of mild cholestasis. Decreased liver synthesis of procoagulant and anticoagulant factors was observed but overall coagulation homeostasis appeared to be in balance in this selected group of patients with a good clinical outcome.
Figures
References
-
- Stamm C, Friehs I, Mayer JE Jr, et al. Long-term results of the lateral tunnel Fontan operation. J Thorac Cardiovasc Surg 2001;121:28–41. - PubMed
-
- Naschitz JE, Slobodin G, Lewis RJ, et al. Heart diseases affecting the liver and liver diseases affecting the heart. Am Heart J 2000;140:111–20. - PubMed
-
- Mace S, Borkat G, Liebman J. Hepatic dysfunction and cardiovascular abnormalities: occurrence in infants, children, and young adults. Am J Dis Child 1985;139:60–5. - PubMed
-
- Cromme-Dijkhuis AH, Hess J, Hahlen K, et al. Specific sequelae after Fontan operation at mid- and long-term follow-up. J Thorac Cardiovasc Surg 1993;106:1126–32. - PubMed
Publication types
MeSH terms
Substances
LinkOut - more resources
Full Text Sources
Research Materials