. 2005 Jan;114(1):63-71.
doi: 10.1111/j.1365-2567.2004.01994.x.

Phenotypic and functional heterogeneity of porcine blood monocytes and its relation with maturation

Affiliations

Phenotypic and functional heterogeneity of porcine blood monocytes and its relation with maturation

Sonia Chamorro et al. Immunology. 2005 Jan.

Abstract

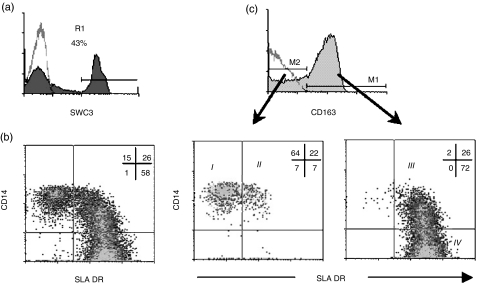
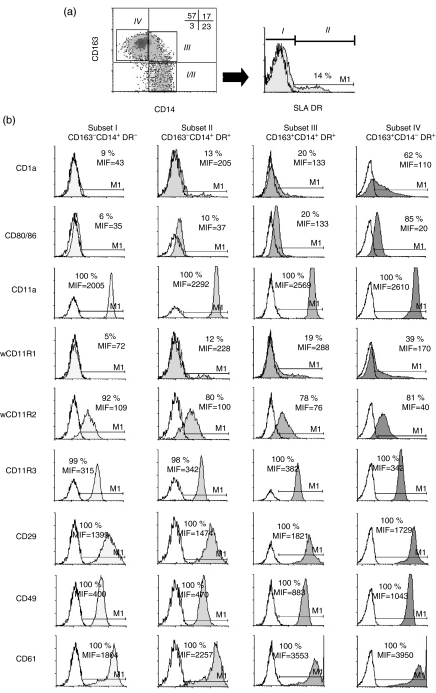
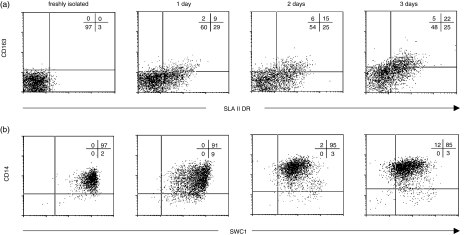
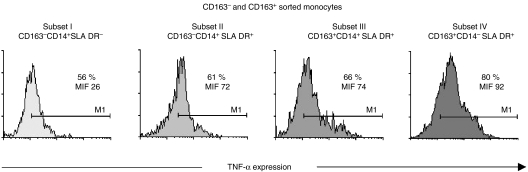
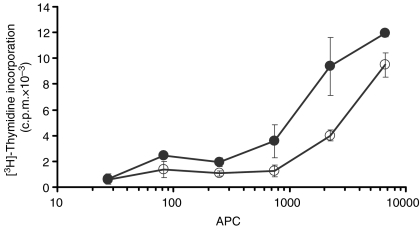
Swine monocytes constitute a heterogeneous population of cells which can be divided into four subsets based on the expression of SWC3, CD14, CD163 and swine leucocyte antigen (SLA) DR markers. These subsets appear to represent different maturation stages in a pathway along which these cells up-regulate the expression of SLA DR and CD163 antigens and reduce that of CD14. Differences in the expression of adhesion and costimulatory molecules are also patent, with a progressive increase in the expression of CD11a, wCD11R1, CD29, CD49d, CD61, CD1a and CD80/86, and a concomitant decrease in that of wCD11R2. Besides, these subsets differ in their capacity for tumour necrosis factor-alpha (TNF-alpha) production in response to lipopolysaccharide + interferon-gamma. The CD163(+) CD14(-) SLA DR(+) subset produces higher amounts of TNF-alpha than the CD163(-) CD14(+) SLA DR(-) subset, whereas CD163(+) CD14(+) SLA DR(+) and CD163(-) CD14(+) SLA DR(+) subsets show intermediate values. CD163(+) monocytes also display a higher ability to present soluble antigens to T cells than CD163(-) monocytes.


Figures

Figure 1
Figure 1
Four-colour immunofluorescence of PBMC with mAbs to SWC3, CD163, CD14 and SLA DR identifies four monocyte subsets in swine. (a) Monocytes were gated (R1) from PBMC as SWC3+ cells. (b) Dot plot of CD14/SLA DR expression in SWC3+ cells of gate R1 defined in (a). (c) CD163 expression in R1-gated cells, and CD14/SLA DR expression in SWC3+ CD163 and SWC3+ CD163+ cells, respectively. Data are representative of seven independent experiments.
Figure 2
Figure 2
Phenotypic differences among monocyte subsets assessed by multicolour flow cytometry. (a) Monocyte subsets were gated according to the expression of CD14 and CD163: (I/II) CD163 CD14+ cells (III) CD163+ CD14+ cells and (IV) CD163+ CD14 cells. Percentages of cells in each quadrant are indicated. Subsets I and II were further defined on CD163 CD14+ cells based on SLA DR expression: (I) CD163 CD14+ SLA DR cells and (II) CD163 CD14+ SLA DR+ cells. (b) Filled histograms represent the expression of the indicated cell-surface markers on the gated subsets. Open histograms correspond to the staining with isotype control mAbs. Percentage of positive cells and mean fluorescence intensity (MFI) are shown. Data are from one representative experiment out of three independently performed.
Figure 3
Figure 3
In vitro serum-induced maturation of subset I. CD163 CD14+ SLA DR monocytes were sorted and cultured for 3 days in complete medium supplemented with 20% porcine serum. At different times cells were harvested and analysed by multicolour flow cytometry with mAbs to CD163, CD14, SLA DR and other surface markers. Dot-plot of SLA DR/CD163 and SWC1/CD14 expression are shown in (a) and (b), respectively. Data are from one representative experiment out of five performed.
Figure 4
Figure 4
TNF-α production by different monocyte subsets. SWC3+ CD163 and SWC3+ CD163+ cells were magnetically sorted from PBMC, and stimulated for 4 hr with LPS (1 μg/ml) plus IFN-γ (50 U/ml) in the presence of monensin (2 μg/ml). Cells were first incubated with Alexa 633-labelled anti-SLA DR and FITC-labelled anti-CD14 mAbs, and then fixed/permeabilized and incubated with PE-labelled anti-TNF-α mAb. The percentage of TNF-α-positive cells in each monocyte subset is shown. Data are representative of two experiments performed.
Figure 5
Figure 5
CD163 and CD163+ monocytes differ in their T-cell stimulatory capacity. Graded numbers of irradiated CD163 monocytes (○) or CD163+ monocytes (•) were stimulated with 20 μg of recall antigen lysozyme and cultured with 1·5 × 105 sorted autologous CD4+ T cells. Proliferation was determined by [3H]thymidine uptake. Data represent the mean ± SEM of counts per minute (c.p.m.) of four replicates. Cultures of CD4+ T cells with CD163 and CD163+ monocytes without antigen were carried out as controls obtaining 130 ± 27 and 224 ± 76 c.p.m., respectively. Results shown are representative of three independent experiments.

References

    1. Gordon S, Keshav S, Chung LP. Mononuclear phagocytes: tissue distribution and functional heterogeneity. Curr Opin Immunol. 1988;1:26–35. - PubMed
    1. Chapuis F, Rosenzwajg M, Yagello M, Ekman M, Biberfeld P, Gluckman JC. Differentiation of human dendritic cells from monocytes in vitro. Eur J Immunol. 1997;27:431–41. - PubMed
    1. Palucka KA, Taquet N, Sanchez-Chapuis F, Gluckman JC. Dendritic cells as the terminal stage of monocyte differentiation. J Immunol. 1998;160:4587–95. - PubMed
    1. Sallusto F, Lanzavecchia A. Efficient presentation of soluble antigen by cultured human dendritic cells is maintained by granulocyte/macrophage colony-stimulating factor plus interleukin 4 and downregulated by tumor necrosis factor alpha. J Exp Med. 1994;179:1109–18. - PMC - PubMed
    1. Banchereau J, Steinman RM. Dendritic cells and the control of immunity. Nature. 1998;392:245–52. - PubMed

Publication types

MeSH terms