

Microarray analysis of gene/transcript expression in Angelman syndrome: deletion versus UPD
- PMID: 15607424
- PMCID: PMC6800218
- DOI: 10.1016/j.ygeno.2004.10.010
Microarray analysis of gene/transcript expression in Angelman syndrome: deletion versus UPD
Abstract
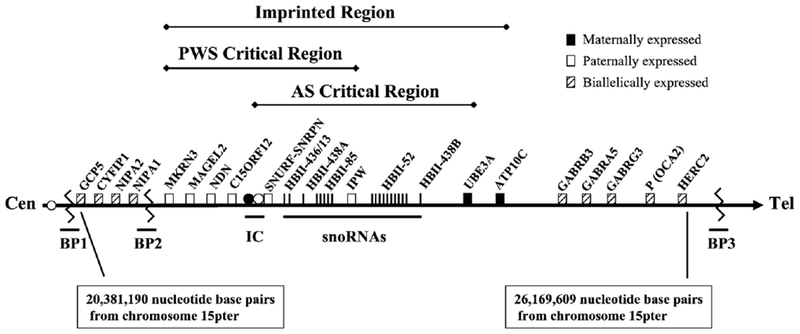
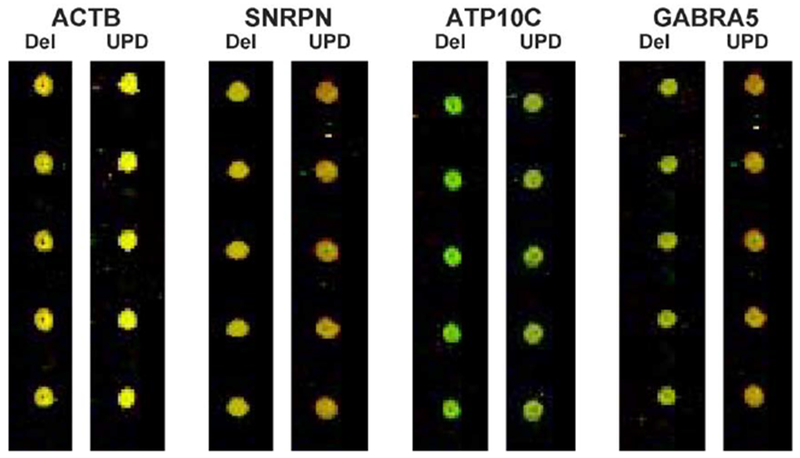
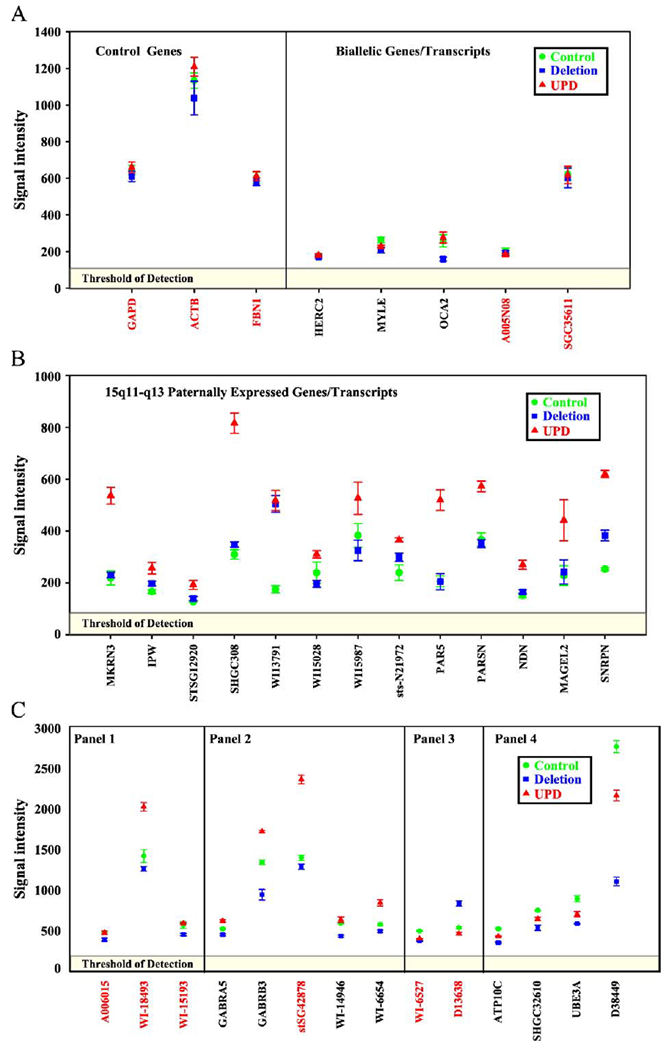
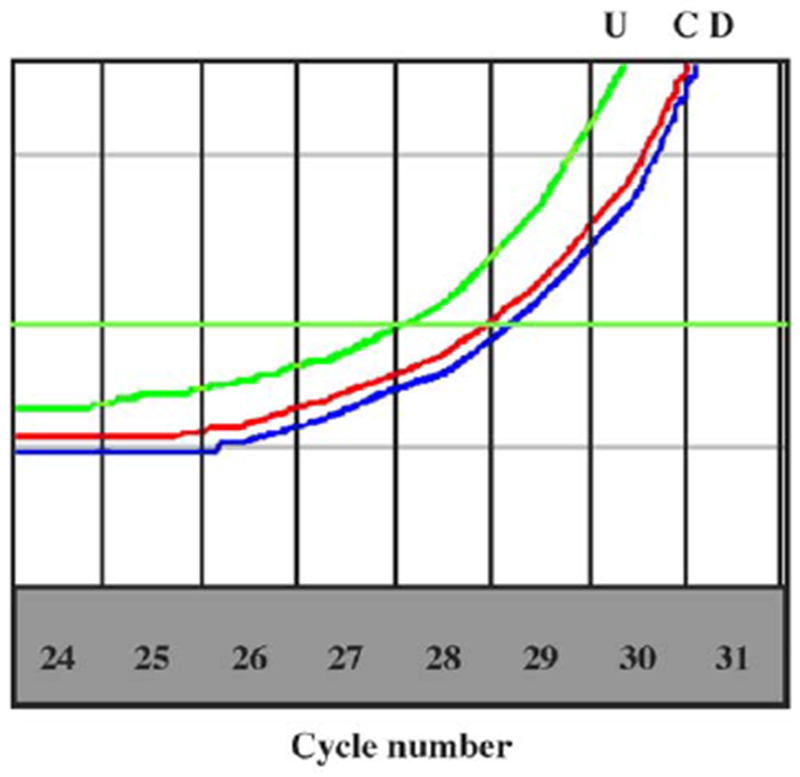
Angelman syndrome (AS) is a neurodevelopmental disorder due to a functional deficit, usually a deletion, of the UBE3A gene located in the 15q11-q13 chromosome region. We report the first microarray analysis of gene expression in AS using a custom cDNA microarray to compare expression patterns from lymphoblastoid cell lines from control males and AS subjects with a 15q deletion or uniparental paternal disomy 15. Expression patterns of genes known to be biallelically expressed or paternally or maternally expressed were consistent with expectations. We detected paternal or maternal allelic bias in the expression of several genes and transcripts (e.g., GABRA5, GABRB3, WI-14946). Additionally, mechanisms controlling paternal allele expression appear to be faithfully replicated in each paternal chromosome in individuals with paternal disomy. Our results indicate that interconnected mechanisms can produce subtle and unexpected changes in gene expression that may help explain the phenotypic differences observed among the genetic subtypes of AS.
Figures
Similar articles
-
Microarray analysis of gene/transcript expression in Prader-Willi syndrome: deletion versus UPD.J Med Genet. 2003 Aug;40(8):568-74. doi: 10.1136/jmg.40.8.568. J Med Genet. 2003. PMID: 12920063 Free PMC article.
-
Angelman syndrome and severe infections in a patient with de novo 15q11.2-q13.1 deletion and maternally inherited 2q21.3 microdeletion.Gene. 2013 Jan 10;512(2):453-5. doi: 10.1016/j.gene.2012.10.061. Epub 2012 Nov 1. Gene. 2013. PMID: 23124039
-
Altered ultrasonic vocalization and impaired learning and memory in Angelman syndrome mouse model with a large maternal deletion from Ube3a to Gabrb3.PLoS One. 2010 Aug 20;5(8):e12278. doi: 10.1371/journal.pone.0012278. PLoS One. 2010. PMID: 20808828 Free PMC article.
-
Prader-Willi syndrome with a karyotype 47,XY,+min(15)(pter->q11.1:) and maternal UPD 15--case report plus review of similar cases.Eur J Med Genet. 2005 Apr-Jun;48(2):175-81. doi: 10.1016/j.ejmg.2005.01.004. Epub 2005 Feb 17. Eur J Med Genet. 2005. PMID: 16053909 Review.
-
Angelman syndrome: a review of the clinical and genetic aspects.J Med Genet. 2003 Feb;40(2):87-95. doi: 10.1136/jmg.40.2.87. J Med Genet. 2003. PMID: 12566516 Free PMC article. Review.
Cited by
-
Gene expression in cardiac tissues from infants with idiopathic conotruncal defects.BMC Med Genomics. 2011 Jan 5;4:1. doi: 10.1186/1755-8794-4-1. BMC Med Genomics. 2011. PMID: 21208432 Free PMC article.
-
Differences between the pattern of developmental abnormalities in autism associated with duplications 15q11.2-q13 and idiopathic autism.J Neuropathol Exp Neurol. 2012 May;71(5):382-97. doi: 10.1097/NEN.0b013e318251f537. J Neuropathol Exp Neurol. 2012. PMID: 22487857 Free PMC article.
-
12-year-old boy with a 4q35.2 microdeletion and involvement of MTNR1A, FAT1, and F11 genes.Clin Dysmorphol. 2012 Apr;21(2):93-96. doi: 10.1097/MCD.0b013e32834e9216. Clin Dysmorphol. 2012. PMID: 22127048 Free PMC article. No abstract available.
-
Immunologic and neurodevelopmental susceptibilities of autism.Neurotoxicology. 2008 May;29(3):532-45. doi: 10.1016/j.neuro.2008.02.006. Epub 2008 Feb 23. Neurotoxicology. 2008. PMID: 18394707 Free PMC article. Review.
-
Somatosensory and sensorimotor consequences associated with the heterozygous disruption of the autism candidate gene, Gabrb3.Behav Brain Res. 2011 Jan 1;216(1):36-45. doi: 10.1016/j.bbr.2010.06.032. Epub 2010 Aug 10. Behav Brain Res. 2011. PMID: 20699105 Free PMC article.
References
-
- Cassidy SB, Dykens E, Williams CA, Prader–Willi and Angelman syndromes: sister imprinted disorders, Am. J. Med. Genet. 97 (2000) 136–146. - PubMed
-
- Meguro M, et al., A novel maternally expressed gene, ATP10C, encodes a putative aminophospholipid translocase associated with Angelman syndrome, Nat. Genet. 28 (2001) 19–20. - PubMed
MeSH terms
Substances
Grants and funding
LinkOut - more resources
Full Text Sources
Medical
Molecular Biology Databases
Research Materials
