

doi: 10.1073/pnas.0408065101.
Epub 2004 Dec 17.
Juvenile zebra finches can use multiple strategies to learn the same song
Affiliations
- PMID: 15608063
- PMCID: PMC539774
- DOI: 10.1073/pnas.0408065101
Item in Clipboard
Juvenile zebra finches can use multiple strategies to learn the same song
Proc Natl Acad Sci U S A.
.
Abstract
Does the ontogeny of vocal imitation follow a set program that, given a target sound, unfolds in a predictable manner, or is it more like problem solving, with many possible solutions? We report that juvenile male zebra finches, Taeniopygia guttata, can master their imitation of the same song in various ways; these developmental trajectories are sensitive to the social setting in which the bird grows up. A variety of vocal developmental trajectories have also been described in infants. Are these many ways to learn unique to the vocal domain or a hallmark of advanced brain function?
Figures
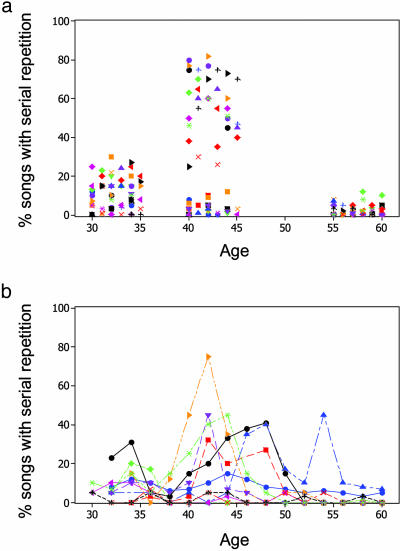
Effects of social setting on the incidence of serial repetition. (a) Sound recordings made from 23 males kept with their families during the subsong (days 30–35), early plastic song (days 40–45), and later plastic song (days 55–60) stages; during those times, each bird was recorded every other day, and birds were recorded on the same day. (b) Sound recordings made every other day from day 30 until day 60 from 12 birds kept singly with an adult. The vertical axis indicates the percentage of all songs produced by a bird during those times that included three or more serial repetitions that met the criterion of 75% similarity.
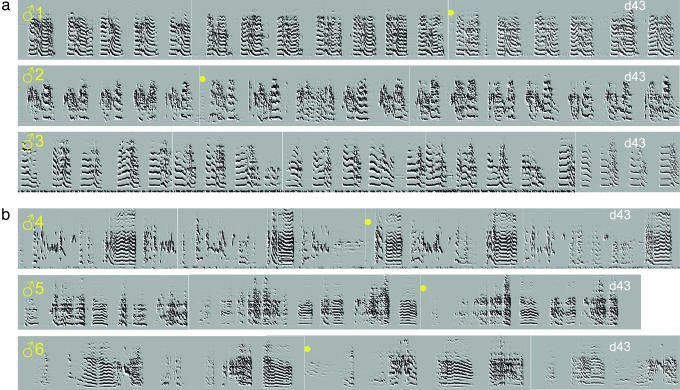
This figure uses time-frequency analysis (10) to illustrate the striking difference in strategy followed by two groups of 43-day-old zebra finch juvenile males; birds in one group (a) produced serial repetitions of a single syllable type; birds in the other group (b) exemplify the early rise of a motif-centered strategy. Time is on the horizontal axis, and frequency is on the vertical axis. Shown for each bird is a sequence of sounds and pauses just as they were delivered, except for the silent interval between consecutive songs, which is not shown. Boundaries between consecutive songs are indicated by yellow dots. The way in which these two strategies emerge during ontogeny is shown in greater detail in Fig. 2.
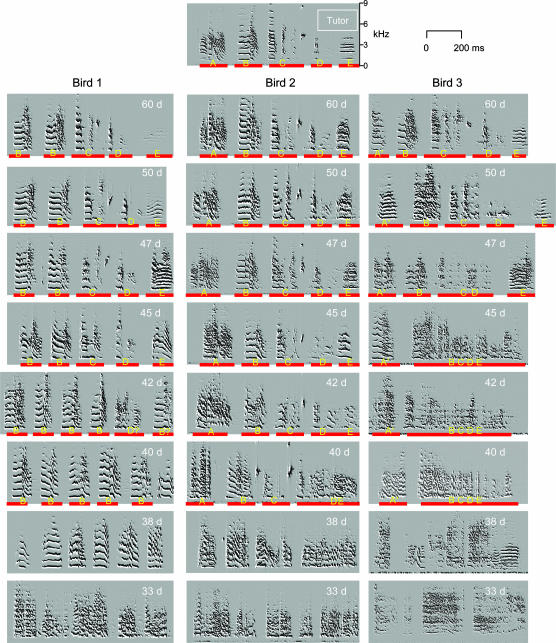
The ontogeny of the song motif in three juvenile zebra finch siblings (birds 1, 2, and 3). The siblings were members of the same clutch and mastered the 1-s-long song motif of their father, labeled “Tutor” in the box on top. The vertical axis corresponds to frequency, in kilohertz, and the horizontal axis corresponds to time, in seconds. The highly stereotyped song motif of the father consisted of five different syllables, identified by letters A–E; each syllable is separated from the next one by a silent interval. In adult song, the motif is repeated several times, back to back, in a bout of song that lasts several seconds. Bouts of similar duration also occur in juveniles. The vocal ontogeny path that each sibling followed until it achieved a close imitation of the tutor song motif is shown by a selection of sounds recorded from the end of the first month after hatching (bottom panels) up to day 60. The examples shown were chosen visually, seeking for each day the best match with the tutor song motif. Further refinements in imitation, not shown here, continue to occur after day 60; by day 90 adult, stable song is in place (data not shown). All of the syllables (A–E) present at 60 days can be tracked to earlier instances, labeled likewise or, for the earliest or less similar versions, labeled A′, B′, etc., which were already in place by about 40 days. For more details, see Results.
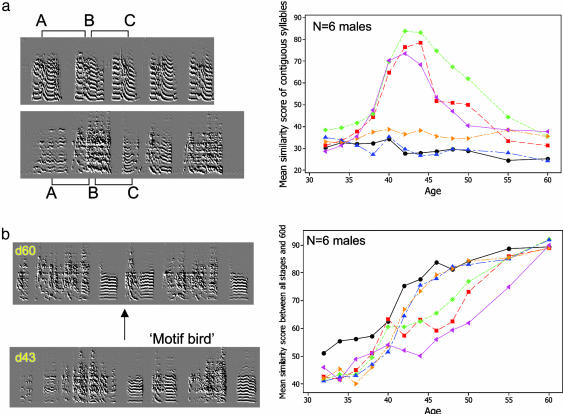
Two approaches that quantified changes of song during the first 60 days. (a) The graph shows mean similarity scores for contiguous syllables recorded in a subset of 6 of our 23 birds that were followed from early subsong (day 32) until the birds produced a clearly recognizable approximation of the tutor song on day 60; three of the birds sang in the serial repetition manner (Left Upper) from day 40 to day 50; the other three sang during this same time in the motif manner (Left Lower). In both cases, for each song sample, syllable A is compared with B, B with C, and so on. (b) For the same six birds, we identified the song that on day 60 (Upper) came closest to the tutor song for that bird. Then we estimated the similarity index obtained when comparing that song and another song on each of several previous days, going back to day 32. The results for each day are based on a sample of 100 songs per bird. Notice that on day 45, three of the birds, representatives of the motif strategy, had higher similarity to the target song than the other three, which showed a high incidence of linear repetition (color identification as in a). In this case the two panels in Left emphasize the type of comparison, between earlier and later song that went into the graph.
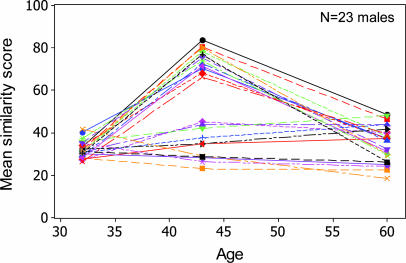
Mean similarity score for contiguous syllables, as in Fig. 3, for the whole group of 23 birds; scores were obtained by using three recording times meant to characterize events during early subsong (day 32), early plastic song (day 43), and later plastic song (day 60). Note that on day 43 similarity scores clump into two separate clusters that correspond, respectively, to the serial repetition and motif strategies.
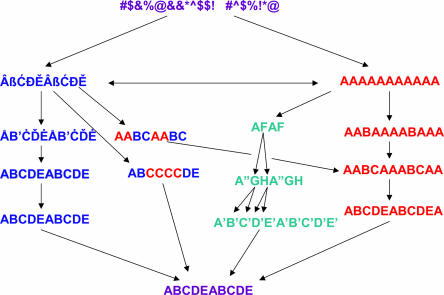
A diversity of trajectories can lead to the same end. The top line is meant to show the poorly structured and diverse sounds of subsong. During plastic song, some birds follow from early on a motif trajectory (left), others a serial repetition trajectory (right); they can go back and forth between these two, but usually one or the other trajectory is emphasized. There are potential branching points. Toward the end of the process, all these trajectories converge on the same final output.
References
-
- Thorpe, W. H. (1958) Ibis 100, 535–570.
-
- Marler, P. J. (1970) Comp. Physiol. Psychol. 71, Suppl., 1–25.
-
- Nottebohm, F. (1972) J. Exp. Zool. 179, 35–49.
-
- Tchernichovski, O., Mitra, P. P., Lints, T. & Nottebohm, F. (2001) Science 291, 2564–2569. - PubMed
-
- Marler, P. & Pickert, R. (1984) Anim. Behav. 32, 673–689.
Publication types
MeSH terms
Grants and funding
LinkOut - more resources
Full Text Sources
