Review
. 2005 Feb 15;563(Pt 1):11-21.
doi: 10.1113/jphysiol.2004.080440. Epub 2004 Dec 20.

Advances in protein complex analysis using mass spectrometry

Affiliations
Review

Advances in protein complex analysis using mass spectrometry

Anne-Claude Gingras et al. J Physiol. .

Abstract

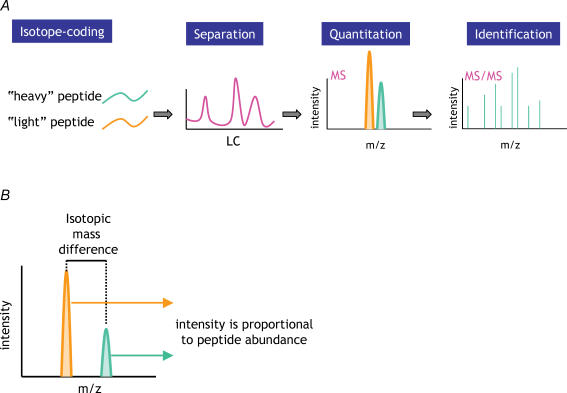
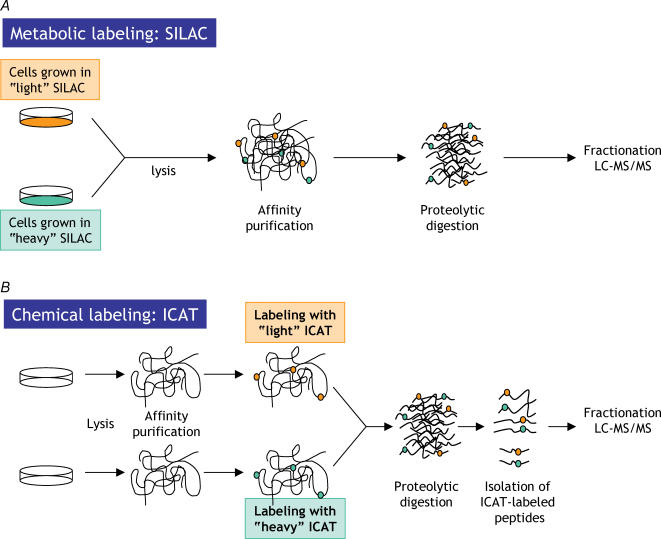
Proteins often function as components of larger complexes to perform a specific function, and formation of these complexes may be regulated. For example, intracellular signalling events often require transient and/or regulated protein-protein interactions for propagation, and protein binding to a specific DNA sequence, RNA molecule or metabolite is often regulated to modulate a particular cellular function. Thus, characterizing protein complexes can offer important insights into protein function. This review describes recent important advances in mass spectrometry (MS)-based techniques for the analysis of protein complexes. Following brief descriptions of how proteins are identified using MS, and general protein complex purification approaches, we address two of the most important issues in these types of studies: specificity and background protein contaminants. Two basic strategies for increasing specificity and decreasing background are presented: whereas (1) tandem affinity purification (TAP) of tagged proteins of interest can dramatically improve the signal-to-noise ratio via the generation of cleaner samples, (2) stable isotopic labelling of proteins may be used to discriminate between contaminants and bona fide binding partners using quantitative MS techniques. Examples, as well as advantages and disadvantages of each approach, are presented.


Figures

Figure 1
Figure 1. General strategy for protein complex identification using mass spectrometry
A, a biological sample is purified and separated into its constituents, which are then proteolysed and analysed by LC-MS (see text for details). B, mass-spectrometry-based protein identification. A mixture of peptides (the peptide of interest is highlighted in pink) is separated by reversed-phase HPLC. The chromatography column is located immediately in-line with the MS, and peptides are analysed as they elute from the column. The mass/charge ratios (m/z) of all co-eluting peptides are first analysed in a survey (or MS) scan. Individual peptide populations are then selected (usually based on abundance) for fragmentation. Finally, the m/z of the peptide fragments are analysed to generate an MS/MS or CID spectrum. The acquired MS/MS spectrum is compared with theoretical spectra obtained via an in silico digest of a relevant protein database. Significant matches are reported, yielding peptide identification.
Figure 2
Figure 2. Tandem affinity purification (TAP) strategy
A, structure of a recombinant C-terminally tagged fusion protein. B, isolation procedure. The orange oval represents a bona fide interactor, the grey circles represent contaminants.
Figure 3
Figure 3. Use of isotopes in quantitative proteomics
A, peptides containing ‘heavy’ or ‘light’ isotopes are separated by RPLC: isotopes co-elute. In the survey (MS) scan, peptides are analysed in the m/z dimension; either isotopic variant can then be selected for fragmentation and analysis by LC-MS/MS to obtain sequence identification. B, the isotopic mass difference allows for separate abundance measurements of the two different peptides; the relative intensity of the peaks is proportional to peptide abundance.
Figure 4
Figure 4. Alternative methods for isotopic labelling of peptides
A, metabolic labelling via SILAC. Coloured circles represent heavy or light amino acids incorporated into proteins. B, chemical labelling via ICAT. Coloured circles represent heavy or light isotope-coded affinity tags covalently bound to cysteine (or other reactive) groups in proteins.
Figure 5
Figure 5. Using quantitative proteomics to identify site-specific DNA-binding proteins
Parallel purifications using WT or mutant DNA sequences are performed; one of the samples is labelled with ‘heavy’ ICAT, the other with ‘light’ ICAT. Samples are processed as above, and analysed via MS. The heavy/light ratios are utilized to identify sequence-specific DNA-binding proteins (or bona fide interacting partners; ratio > 1) versus sequence non-specific DNA-binding contaminants (ratio ∼1).

References

    1. Bauer A, Kuster B. Affinity purification-mass spectrometry. Powerful tools for the characterization of protein complexes. Eur J Biochem. 2003;270:570–578. - PubMed
    1. Bertwistle D, Sugimoto M, Sherr CJ. Physical and functional interactions of the Arf tumor suppressor protein with nucleophosmin/B23. Mol Cell Biol. 2004;24:985–996. - PMC - PubMed
    1. Blagoev B, Kratchmarova I, Ong SE, Nielsen M, Foster LJ, Mann M. A proteomics strategy to elucidate functional protein–protein interactions applied to EGF signaling. Nat Biotechnol. 2003;21:315–318. - PubMed
    1. Blagoev B, Ong SE, Kratchmarova I, Mann M. Temporal analysis of phosphotyrosine-dependent signaling networks by quantitative proteomics. Nat Biotechnol. 2004;22:1139–1145. - PubMed
    1. Bouwmeester T, Bauch A, Ruffner H, Angrand PO, Bergamini G, Croughton K, et al. A physical and functional map of the human TNF-alpha/NF-kappa B signal transduction pathway. Nat Cell Biol. 2004;6:97–105. - PubMed

Publication types

LinkOut - more resources