Genetic determination of susceptibility to estrogen-induced mammary cancer in the ACI rat: mapping of Emca1 and Emca2 to chromosomes 5 and 18
- PMID: 15611180
- PMCID: PMC1448731
- DOI: 10.1534/genetics.104.033878
Genetic determination of susceptibility to estrogen-induced mammary cancer in the ACI rat: mapping of Emca1 and Emca2 to chromosomes 5 and 18
Abstract
Hormonal, genetic, and environmental factors play major roles in the complex etiology of breast cancer. When treated continuously with 17beta-estradiol (E2), the ACI rat exhibits a genetically conferred propensity to develop mammary cancer. The susceptibility of the ACI rat to E2-induced mammary cancer appears to segregate as an incompletely dominant trait in crosses to the resistant Copenhagen (COP) strain. In both (ACI x COP)F(2) and (COP x ACI)F(2) populations, we find strong evidence for a major genetic determinant of susceptibility to E2-induced mammary cancer on distal rat chromosome 5. Our data are most consistent with a model in which the ACI allele of this locus, termed Emca1 (estrogen-induced mammary cancer 1), acts in an incompletely dominant manner to increase both tumor incidence and tumor multiplicity as well as to reduce tumor latency in these populations. We also find evidence suggestive of a second locus, Emca2, on chromosome 18 in the (ACI x COP)F(2) population. The ACI allele of Emca2 acts in a dominant manner to increase incidence and decrease latency. Together, Emca1 and Emca2 act independently to modify susceptibility to E2-induced mammary cancer.
Figures


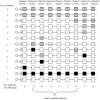
 ) Indicates that an allelic imbalance event consistent with either a loss of the COP or a gain of the ACI allele was detected at that marker in the indicated number of tumors. (▪) Indicates that an allelic imbalance event consistent with either a loss of the ACI or a gain of the COP allele was detected at that marker in the indicated number of tumors. “ND” indicates that a genotype at the indicated marker could not be determined. Map distances are not drawn to scale.
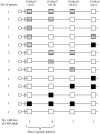
 ) Indicates that an allelic imbalance event consistent with either a loss of the COP or a gain of the ACI allele was detected at that marker in the indicated number of tumors. (▪) Indicates that an allelic imbalance event consistent with either a loss of the ACI or a gain of the COP allele was detected at that marker in the indicated number of tumors. Map distances are not drawn to scale.
References
-
- An, H. X., A. Claas, L. Savelyeva, S. Seitz, P. Schlag et al., 1999. Two regions of deletion in 9p23–24 in sporadic breast cancer. Cancer Res. 59: 3941–3943. - PubMed
-
- Bernstein, L., 2002. Epidemiology of endocrine-related risk factors for breast cancer. J. Mammary Gland Biol. Neoplasia 7: 3–15. - PubMed
-
- Bieche, I., and R. Lidereau, 1995. Genetic alterations in breast cancer. Genes Chromosomes Cancer 14: 227–251. - PubMed
-
- Borg, A., T. Sandberg, K. Nilsson, O. Johannsson, M. Klinker et al., 2000. High frequency of multiple melanomas and breast and pancreas carcinomas in CDKN2A mutation-positive melanoma families. J. Natl. Cancer Inst. 92: 1260–1266. - PubMed
Publication types
MeSH terms
Substances
Grants and funding
LinkOut - more resources
Full Text Sources

