Meta-Analysis
. 2004 Dec;168(4):2169-85.
doi: 10.1534/genetics.104.032375.

Genetic architecture of flowering time in maize as inferred from quantitative trait loci meta-analysis and synteny conservation with the rice genome

Affiliations
Meta-Analysis

Genetic architecture of flowering time in maize as inferred from quantitative trait loci meta-analysis and synteny conservation with the rice genome

Fabien Chardon et al. Genetics. 2004 Dec.

Abstract

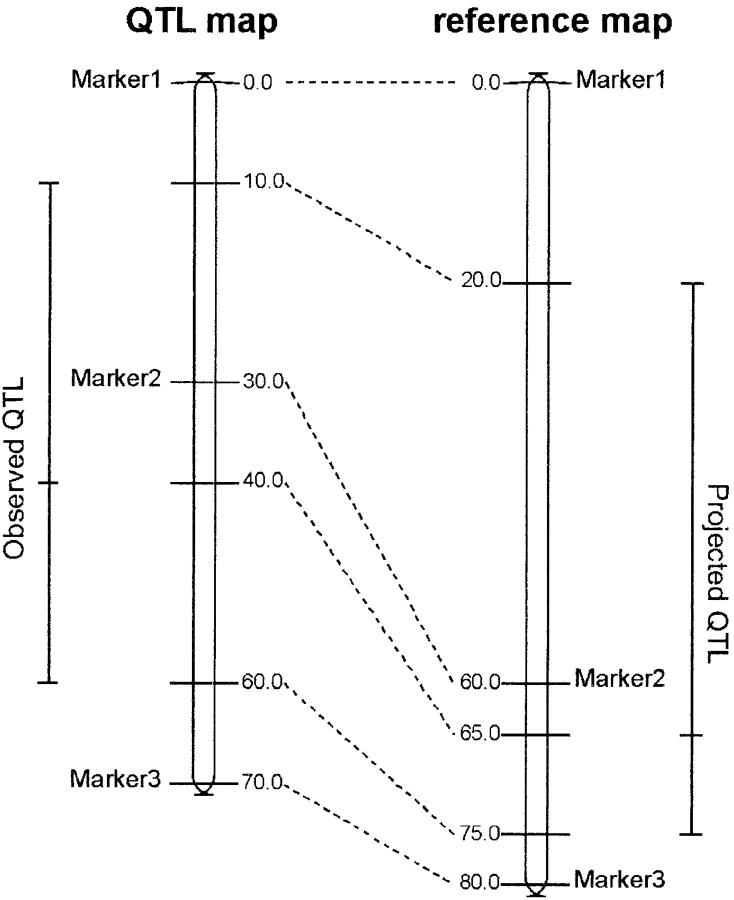
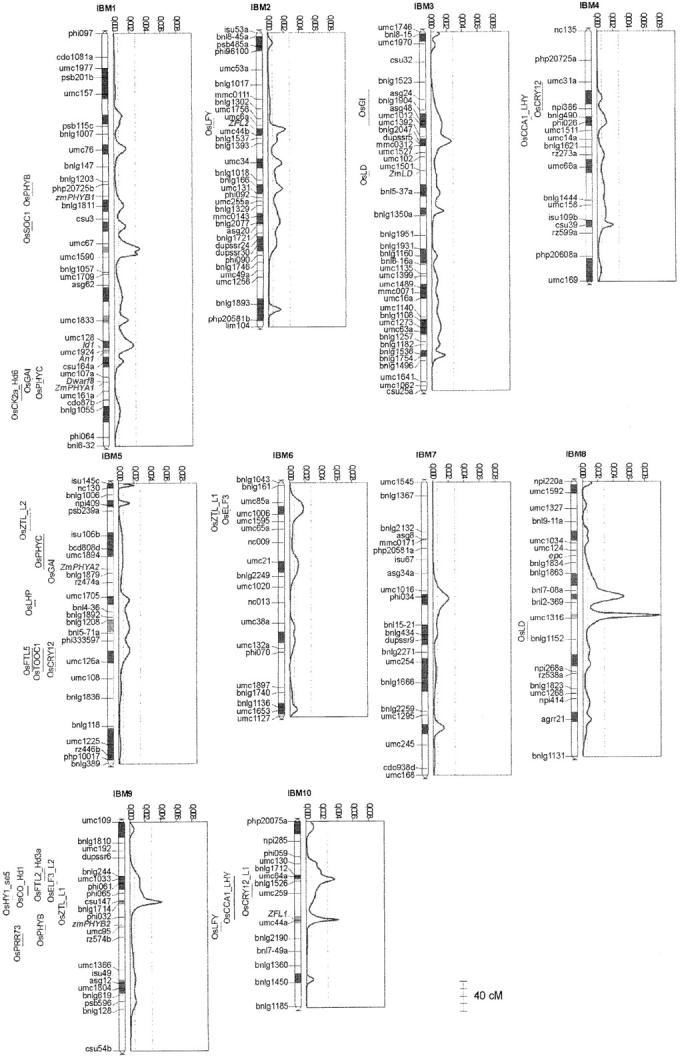
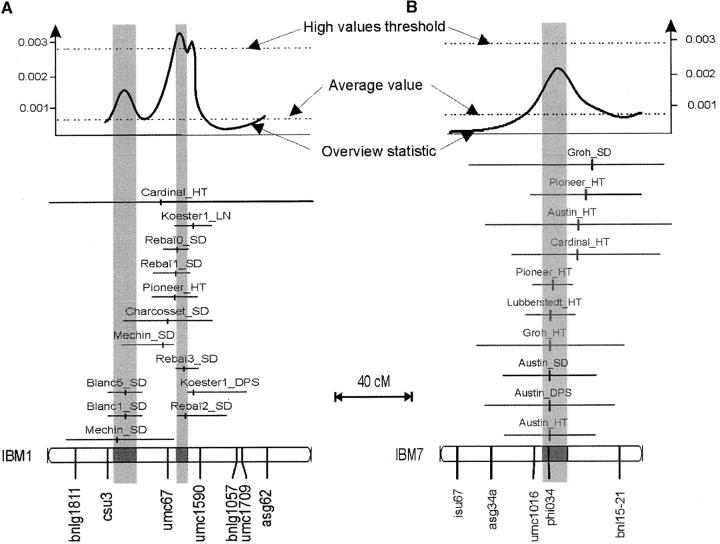
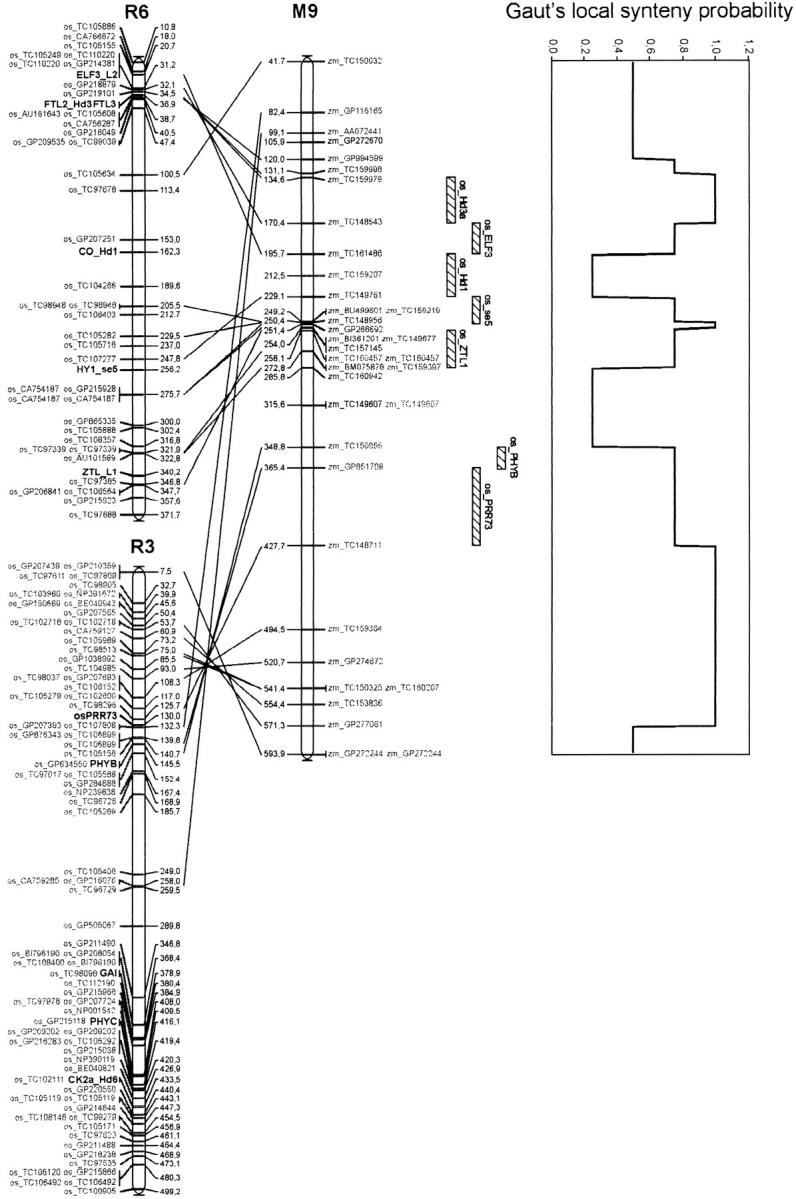
Genetic architecture of flowering time in maize was addressed by synthesizing a total of 313 quantitative trait loci (QTL) available for this trait. These were analyzed first with an overview statistic that highlighted regions of key importance and then with a meta-analysis method that yielded a synthetic genetic model with 62 consensus QTL. Six of these displayed a major effect. Meta-analysis led in this case to a twofold increase in the precision in QTL position estimation, when compared to the most precise initial QTL position within the corresponding region. The 62 consensus QTL were compared first to the positions of the few flowering-time candidate genes that have been mapped in maize. We then projected rice candidate genes onto the maize genome using a synteny conservation approach based on comparative mapping between the maize genetic map and japonica rice physical map. This yielded 19 associations between maize QTL and genes involved in flowering time in rice and in Arabidopsis. Results suggest that the combination of meta-analysis within a species of interest and synteny-based projections from a related model plant can be an efficient strategy for identifying new candidate genes for trait variation.


Figures

F<sc>igure</sc> 1.—
Figure 1.—
Principle of QTL projection on the reference map. A QTL observed in an initial experiment is represented by its most likely position and the limits of its 5% confidence interval (QTL map, left). Corresponding positions are projected onto the reference map by homothetic function, using Marker1, Marker2, and Marker3 as commons markers.
F<sc>igure</sc> 2.—
Figure 2.—
Overview and meta-analysis of QTL affecting flowering time in maize. The overview statistic was calculated every 0.5 cM and plotted along each chromosome. The two vertical dotted lines are the average value of the statistic and the threshold for “high values,” defined empirically as five times the average value. Consensus loci estimated by meta-analysis are drawn on each chromosome as darkly shaded rectangles by default and lightly shaded rectangles if they clustered QTL affecting all traits. Flowering-time genes mapped in maize are represented in italics. Positions of flowering time genes predicted on the basis of local rice-maize synteny conservation have been placed to the left of the map.
F<sc>igure</sc> 3.—
Figure 3.—
Illustration of meta-analysis for regions of chromosomes 1 (A) and 7 (B). Initial QTL and their confidence interval are represented along chromosomes as horizontal lines. Vertical rectangles represent confidence intervals of consensus QTL estimated by meta-analysis. On chromosome 1 (A), the overview statistic presented three peaks over the average value, out of which two exceeded the fivefold factor for high values. Meta-analysis of this region defined two consensus QTL, with confidence intervals two times smaller than the smallest corresponding initial confidence interval. On chromosome 7 (B), 10 QTL affected principally plant height. The overview statistic presented one peak over the average value. Meta-analysis of this region defined a single consensus QTL.
F<sc>igure</sc> 4.—
Figure 4.—
Location of candidate genes for flowering time on the Oryza sativa ssp. japonica genome. Shaded bands localize the centromeric region on the 12 chromosomes. Genetic positions are inferred from that of the corresponding BAC clones.
F<sc>igure</sc> 5.—
Figure 5.—
Details of the relationships between maize chromosome 9 and rice chromosomes 6 and 3. Positions are indicated on the chromosome's right side and left side, respectively, for rice and maize. Since the maize genome is more than six times bigger than the rice genome, we multiplied arbitrarily by three every rice genetic distance to facilitate the graphic comparison between the two genomes with MapChart (Voorrips 2002). Hatched rectangles drawn on the right of the maize map represent the projection of rice segments where flowering-time genes have been mapped. Gaut's local synteny probability was plotted along the right side of maize chromosome 9.

References

    1. Abler, B. S. B., M. D. Edwards and C. W. Stuber, 1991. Isoenzymatic identification of quantitative trait loci in crosses of elite maize inbreds. Crop Sci. 31: 267–274.
    1. Altschul, S. F., T. L. Madden, A. A. Schaeffer, J. Zhang, Z. Zhang et al., 1997. Gapped BLAST and PSI-BLAST: a new generation of protein database search programs. Nucleic Acids Res. 25: 3389–3402. - PMC - PubMed
    1. Arcade, A., A. Labourdette, M. Falque, B. Mangin, F. Chardon et al., 2004. BioMercator: integrating genetic maps and QTL towards discovery of candidate genes. Bioinformatics 20: 2324–2326. - PubMed
    1. Austin, D. F., and M. Lee, 1996. Genetic resolution and verification of quantitative trait loci for flowering and plant height with recombinant inbred lines of maize. Genome 39: 957–968. - PubMed
    1. Basu, D., K. Dehesh, H. J. Schneider-Poetsch, S. E. Harrington, S. R. McCouch et al., 2000. Rice PHYC gene: structure, expression, map position and evolution. Plant Mol. Biol. 41: 27–42. - PubMed

Publication types

Substances