. 2005 Jan 1;174(1):164-73.
doi: 10.4049/jimmunol.174.1.164.

Dysfunctional blood and target tissue CD4+CD25high regulatory T cells in psoriasis: mechanism underlying unrestrained pathogenic effector T cell proliferation

Affiliations

Dysfunctional blood and target tissue CD4+CD25high regulatory T cells in psoriasis: mechanism underlying unrestrained pathogenic effector T cell proliferation

Hideaki Sugiyama et al. J Immunol. .

Abstract

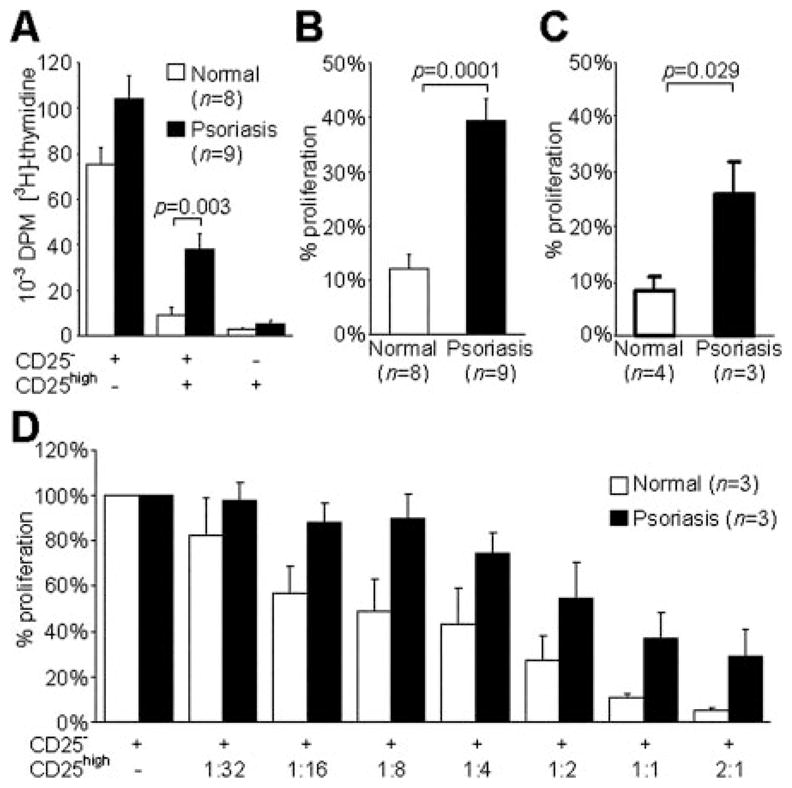
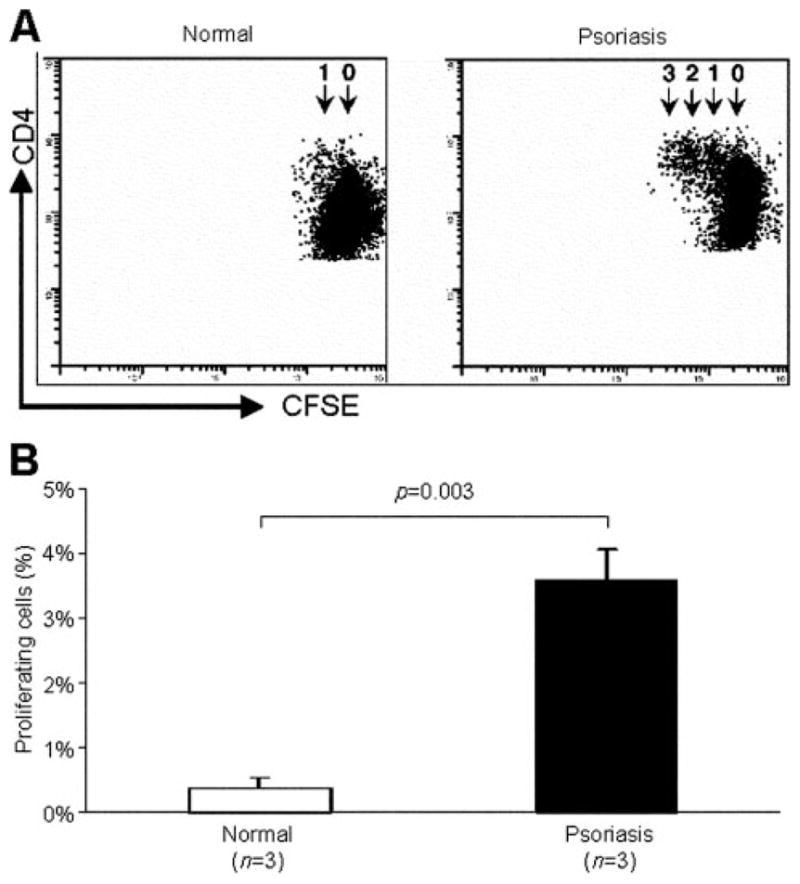
The balance between regulatory and effector functions is important for maintaining efficient immune responses, while avoiding autoimmunity. The inflammatory skin disease psoriasis is sustained by the ongoing activation of pathogenic effector T cells. We found that a CD4(+) T lymphocyte subpopulation in peripheral blood, phenotypically CD25(high), CTLA-4(+), Foxp3(high) (regulatory T (Treg) cells), is deficient in its suppressor activity in psoriasis. This was associated with accelerated proliferation of CD4(+) responder T cells in psoriasis, the majority of which expressed CXCR3. Nevertheless, criss-cross experiments isolated the defect to psoriatic Treg cells. To examine Treg cells in a nonlymphoid tissue of a human T cell-mediated disease, Treg cells were also analyzed and isolated from the site of inflammation, psoriatic lesional skin. At the regulatory vs effector T cells ratios calculated to be present in skin, however, the psoriatic Treg cell population demonstrated decreased suppression of effector T cells. Thus, dysfunctional blood and target tissue CD4(+)CD25(high) Treg cell activity may lead to reduced restraint and consequent hyperproliferation of psoriatic pathogenic T cells in vivo. These findings represent a critical component of human organ-specific autoimmune disease and may have important implications with regard to the possible therapeutic manipulation of Treg cells in vivo.


Figures

FIGURE 1
FIGURE 1
Similar proportions of CD4+CD25high Treg cells in normal and psoriatic peripheral blood. PBMCs of normal volunteers and psoriatic patients were stained with anti-CD4 and anti-CD25 mAbs and analyzed by flow cytometry. A, Representative flow cytometry diagrams showing CD25high, CD25mid, and CD25 peripheral blood CD4+ T cells in a normal volunteer and a psoriatic patient. B, Statistical analysis of the CD25+/CD4+ and CD25high/CD4+ ratios in peripheral blood of normal volunteers and psoriatic patients. Data represent the summary of eight (normal) and six (psoriasis) independent experiments ± SEM. C, Flow cytometric analysis of cell surface and intracellular molecule expression of normal and psoriatic CD4+CD25high, CD4+CD25low, and CD4+CD25 T cells. PB-MCs were prepared from peripheral blood of normal volunteers (n = 2) and psoriatic patients (n = 2). After overnight resting, nonadherent cells were stained with anti-CD4-allophycocyanin, anti-CD25-PE, and anti-CD45RO-FITC; anti-HLA-DR-FITC, anti-CD69-FITC, anti-CD62 ligand (CD62L)-FITC, and anti-CD45RA-FITC; or anti-CD4-APC, anti-CD25-FITC, and anti-CTLA-4-PE. Control samples stained with IgG2a-FITC, IgG2b-FITC, or IgG2a-PE as the third color are not shown, because they were identical with the staining pattern for the IgG1 isotype control. Numbers in the upper right corners represent the percentages of positive cells. A representative result of two independent experiments (for both normal and psoriatic individuals) is shown. D, Magnetic bead-selected (upper panels) or flow cytometry-sorted (lower panels) CD25highCD4+ T cells from normal and psoriatic PBMC were stained with anti-CD25 mAb (■) or isotype (□) and analyzed by flow cytometry. Representative diagrams show >90% purity of sorted populations.
FIGURE 2
FIGURE 2
CD4+CD25high Treg cells showed high copy numbers of Foxp3 mRNA in psoriatic and normal blood. Foxp3 mRNA expression was determined by real-time quantitative RT-PCR. Total RNA, extracted from magnetic bead-selected (upper panels) or flow cytometry-sorted (lower panels) CD25highCD4+ and CD25CD4+ T cells from normal and psoriatic PBMC, was reverse transcribed and amplified in the presence of specific primers and probes for Foxp3 or 18S. All assays were performed in triplicate. Results are expressed as relative Foxp3 copy numbers (mean ± SEM), where the Foxp3 expression of one normal individual was designated 1. Data represent the summary of independent experiments of two psoriatic patients and two healthy controls.
FIGURE 3
FIGURE 3
Psoriatic peripheral blood Treg cells are less potent inhibitors of T cell proliferation. A, Magnetic bead-sorted CD4+CD25 and CD4+CD25high T cells (designated CD25 and CD25high, respectively) purified from peripheral blood of normal volunteers and psoriatic patients were mixed at an equal ratio and cultured with allogeneic APCs. Proliferation was assessed by [3H]thymidine incorporation assay. Data are the summary of eight (normal) and nine (psoriatic) independent experiments. Results are expressed as the mean ± SEM. B and C, Comparison of the relative inhibitory functions of alloantigen-stimulated and anti-CD3-stimulated normal and psoriatic Treg cells. The proliferative results are expressed as the percentage response. The proliferation of alloantigen-stimulated (B) and anti-CD3-stimulated (C) CD4+CD25 T cells was normalized to 100%. Data are the summary of eight (normal) and nine (pso-riatic) independent experiments (B) and four (normal) and three (psoriatic) independent experiments (C). Results are expressed as the mean ± SEM. D, CD25high and CD25 T cells prepared as described in A were mixed at the indicated ratios and cultured with allogeneic APCs. The relative proliferative results of normal and psoriatic Treg cells are expressed as the percent proliferation of alloantigen-stimulated CD4+CD25 T cells. Data are the summary of three independent experiments for both normal and psoriatic individuals. Results are expressed as the mean ± SEM.
FIGURE 4
FIGURE 4
Psoriatic Treg cells inadequately control the proliferation of normal Tresp cells. CD4+CD25 and CD4+CD25high T cells (designated CD25 and CD25high, respectively) were purified by flow cytometry from normal (Norm) and psoriatic (Pso) PBMCs. Normal CD4+CD25 T cells were mixed with autologous or psoriatic CD4+CD25high T cells at an equal ratio and vice versa and were cultured in the presence of allogeneic APCs. Proliferation was assessed by [3H]thymidine incorporation assay. Results represent the summary of two independent experiments (four individuals) and are expressed as a percentage of the relative proliferation (mean ± SEM). The proliferation of corresponding normal or psoriatic alloantigen-stimulated CD4+CD25 T cells was normalized to 100%.
FIGURE 5
FIGURE 5
Psoriatic Treg cells are completely anergic to CD3/CD28 stimulation. Magnetic bead-sorted CD4+CD25high Treg cells from normal volunteers and psoriatic patients were cultured with or without plate-bound anti-CD3 and soluble anti-CD28 mAbs in the presence or the absence of rIL-2. A, Proliferation of cells was assessed by [3H]thymidine incorporation assay. Data represent the average results from independent experiments involving four psoriatic patients and four normal individuals. Results are expressed as the mean ± SEM. B, IL-2 mRNA expression by real-time quantitative RT-PCR. Total RNA, extracted from anti-CD3/anti-CD28-stimulated normal and psoriatic CD4+CD25high and CD4+CD25 T cells, was reverse transcribed and amplified in the presence of specific primers and probes for IL-2 or 18S. All assays were performed in triplicate, and copy numbers were calculated using absolute plasmid standards. Data represent the summary of independent experiments of two psoriatic patients and two healthy controls. Results are expressed as IL-2 copy numbers normalized to 18S rRNA (mean ± SEM).
FIGURE 6
FIGURE 6
CD4+CD25high Treg cells from normal and psoriatic peripheral blood express similar copy numbers of Th1- and Th2-type cytokine mRNA. Total RNA, extracted from flow-sorted CD4+CD25high and CD4+CD25 T cells from normal and psoriatic PBMC, was reverse transcribed and amplified in the presence of specific primers and probes for cytokines or 18S. The ratios of IFN-γ/18S mRNA (A), IL-4/18S mRNA (B), and IL-10/18S mRNA (C) of CD4+CD25high and CD4+CD25 T cells in normal and psoriatic PBMC were compared. TGF-β results (D) are expressed as the relative TGF-β copy number, where the TGF-β expression of one normal individual’s CD4+CD25 T cells was designated 1. All assays were performed in triplicate. Data represent the summary of independent experiments with two psoriatic patients and two healthy controls.
FIGURE 7
FIGURE 7
Early proliferative response of psoriatic CD4+CD25 Tresp cells. A, Magnetic bead-sorted CD4+CD25 Tresp cells from normal volunteers and psoriatic patients were labeled with CFSE and cultured with allogeneic APCs. After 3 days, cells were harvested, stained with anti-CD4 mAb, and analyzed by flow cytometry. Up to three divisions were observed in the case of psoriatic CD4+CD25 Tresp cells, whereas normal CD4+CD25 Tresp cells divided only once. A representative result of three independent experiments (for both normal and psoriatic individuals) is shown. B, The percentage of proliferating populations of total CFSE-labeled CD4+CD25 T cells. Data represent the average results from three independent experiments for both normal and psoriatic individuals. Results are expressed as the mean ± SEM.
FIGURE 8
FIGURE 8
The skin-homing CLA+CD4+ T cell population contains a high proportion of CD4+CD25high Treg cells. A, PBMCs of normal volunteers and psoriatic patients were stained with anti-CD4, anti-CD25, and anti-CLA mAbs and analyzed by flow cytometry. One representative figure each of eight (normal) and six (psoriasis) independent experiments is presented; CLA+ gated cells are shown. B, Proportion of CD25highCD4+Treg cells in the total CD4+, skin-homing (CLA+CD4+), and non-skin-homing (CLACD4+) T cell populations of normal and psoriatic peripheral blood. C, Skin-homing CLA+CD4+CD25high, non-skin-homing CLACD4+CD25high psoriatic peripheral blood Treg cells, and autologous CD4+CD25Tresp cells (designated CLA+CD25high, CLACD25high, and CD25, respectively) were cultured with allogeneic APCs. Proliferation was assessed by [3H]thymidine incorporation assay. Data are the summary of three independent experiments. Results are expressed as the mean ± SEM.
FIGURE 9
FIGURE 9
Treg cells in psoriatic epidermis and dermis. A, The percentage of CD25highCTLA-4+ Treg cells in psoriatic epidermis and dermis. Data are the summary of three independent experiments. Results are expressed as the mean ± SEM. B, Psoriatic peripheral blood CD4+CD25 T cells (designated CD25) were cultured with allogeneic APCs in the presence or the absence of lesional skin dermal CD25+ cells (designated dermal CD25+) at the indicated ratios. Proliferation was assessed by [3H]thy-midine incorporation assay. The relative inhibitory function of psoriatic lesional dermal CD25+ cells is expressed as the percent response of alloantigen-stimulated CD4+CD25 T cells. The proliferation of alloantigen-stimulated CD4+CD25 T cells was normalized to 100%. Data are the summary of three (normal) and three (psoriatic) independent experiments. Results are expressed as the mean ± SEM. C, Comparison of the relative inhibitory function of psoriatic lesional dermal CD25+ T cells and normal peripheral blood CD4+CD25high T cells (as described in Fig. 3, B and D, and Fig. 9B). The relative inhibitory function of psoriatic lesional dermal CD25+ cells and normal peripheral blood CD4+CD25high T cells is expressed as the percent response of alloantigen-stimulated psoriatic and normal CD4+CD25 T cells at the indicated ratios, respectively. The proliferation of alloantigen-stimulated CD4+CD25 T cells was normalized to 100%. Data are the summary of three (normal) and two (psoriatic) independent experiments, each with at least triplicate determinations. Results are expressed as the mean; lines represent best-fit curves (solid, normal; dotted, psoriasis).

References

    1. Maloy KJ, Powrie F. Regulatory T cells in the control of immune pathology. Nat Immunol. 2001;2:816. - PubMed
    1. Asano M, Toda M, Sakaguchi N, Sakaguchi S. Autoimmune disease as a consequence of developmental abnormality of a T cell subpopulation. J Exp Med. 1996;184:387. - PMC - PubMed
    1. Takahashi T, Kuniyasu Y, Toda M, Sakaguchi N, Itoh M, Iwata M, Shimizu J, Sakaguchi S. Immunologic self-tolerance maintained by CD25+CD4+ naturally anergic and suppressive T cells: induction of autoimmune disease by breaking their anergic/suppressive state. Int Immunol. 1998;10:1969. - PubMed
    1. Thornton AM, Shevach EM. CD4+CD25+ immunoregulatory T cells suppress polyclonal T cell activation in vitro by inhibiting interleukin 2 production. J Exp Med. 1998;188:287. - PMC - PubMed
    1. Suri-Payer E, Amar AZ, Thornton AM, Shevach EM. CD4+CD25+ T cells inhibit both the induction and effector function of autoreactive T cells and represent a unique lineage of immunoregulatory cells. J Immunol. 1998;160:1212. - PubMed

Publication types