. 2004 Dec 20;167(6):1241-53.
doi: 10.1083/jcb.200404160.

The primacy of affinity over clustering in regulation of adhesiveness of the integrin {alpha}L{beta}2

Affiliations

The primacy of affinity over clustering in regulation of adhesiveness of the integrin {alpha}L{beta}2

Minsoo Kim et al. J Cell Biol. .

Abstract

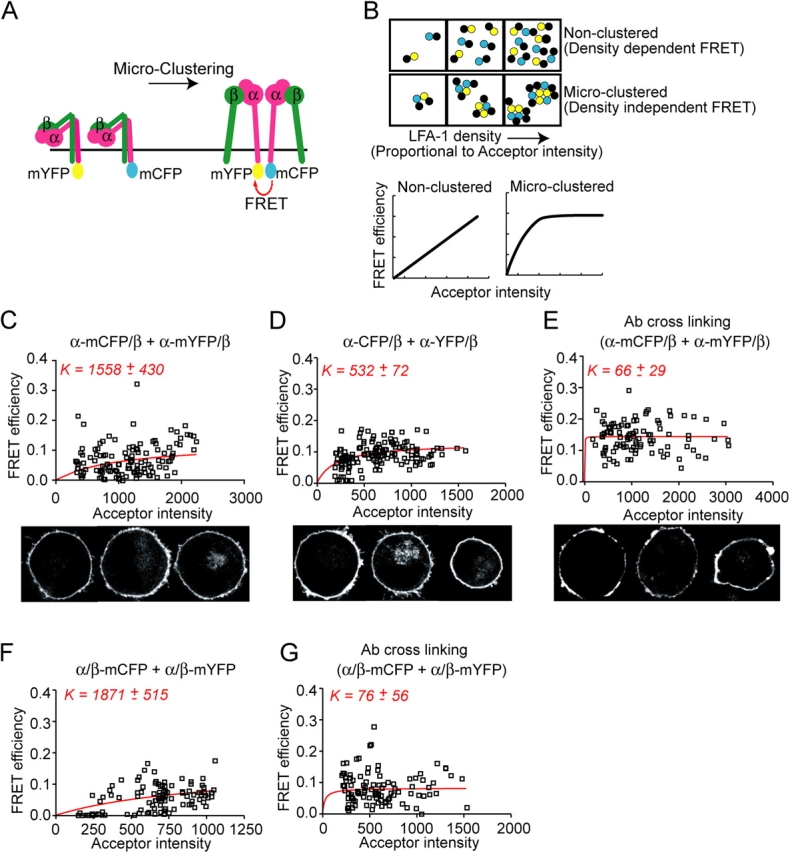
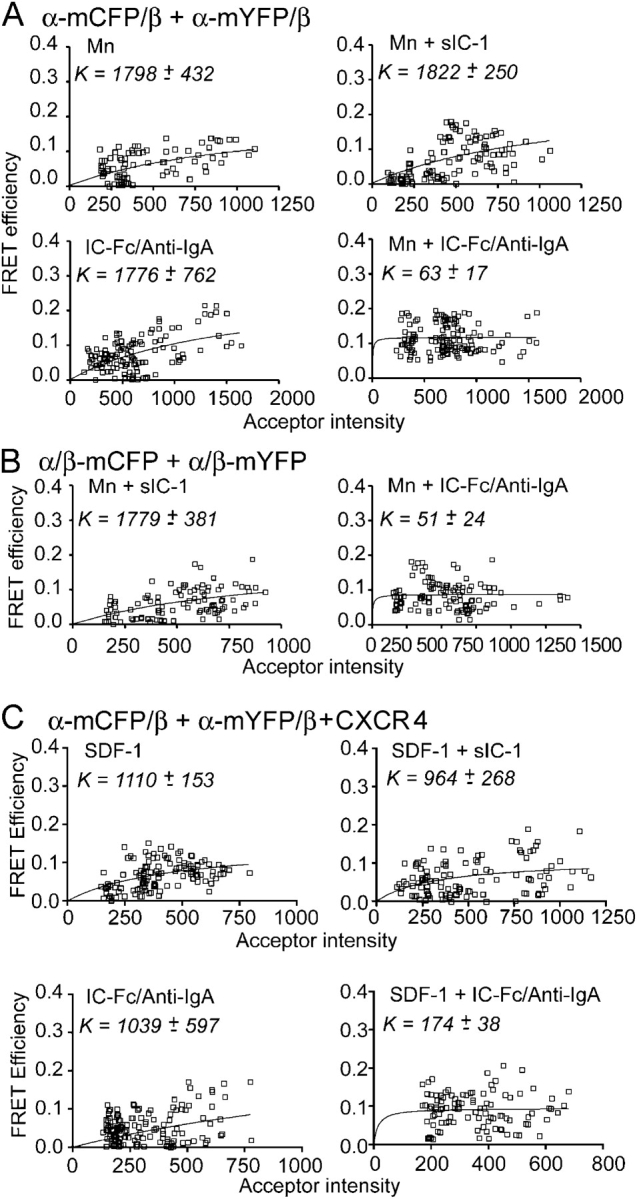
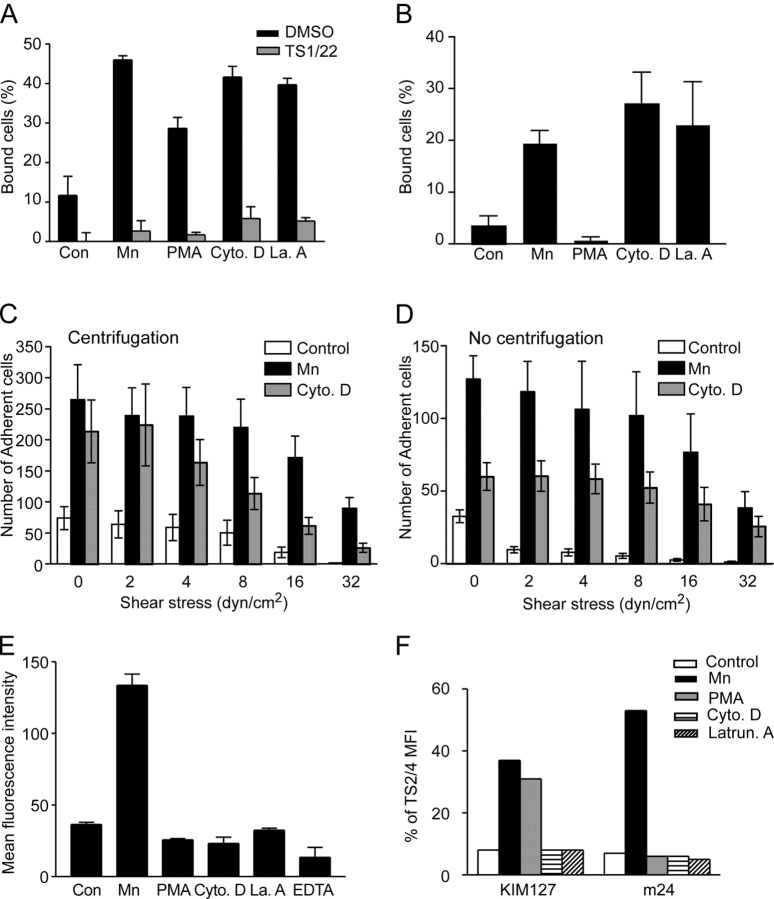
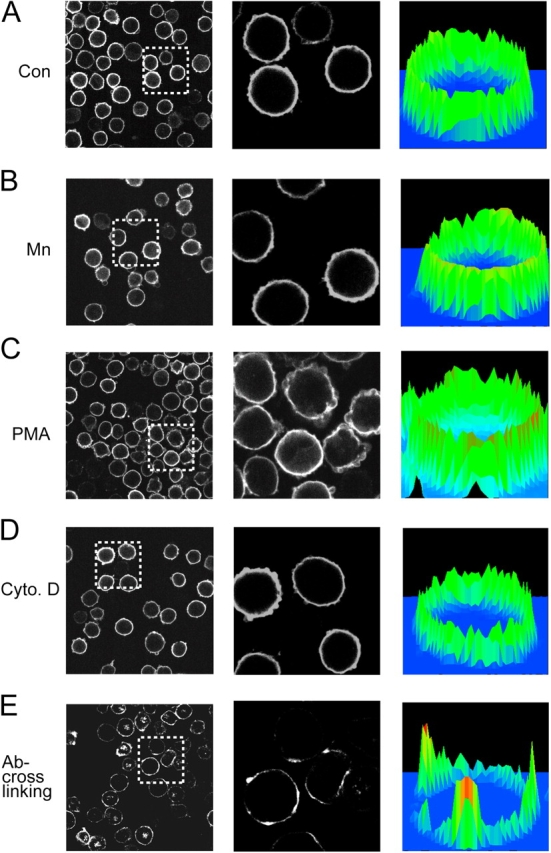
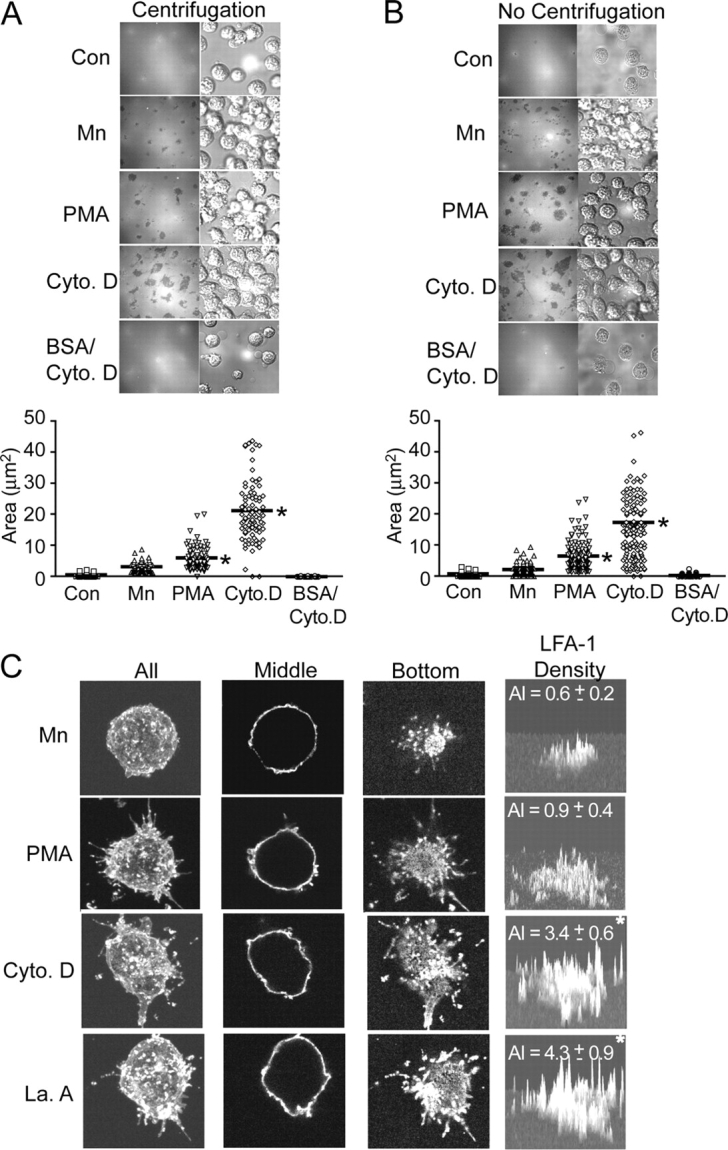
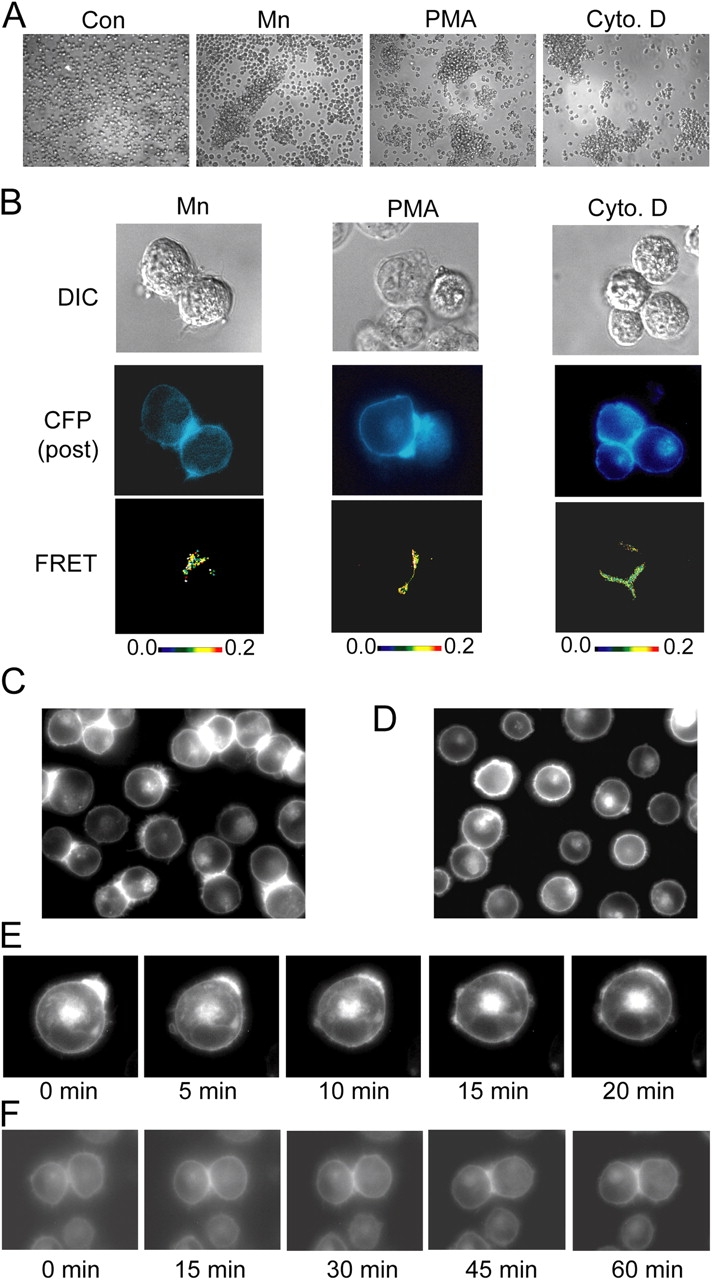
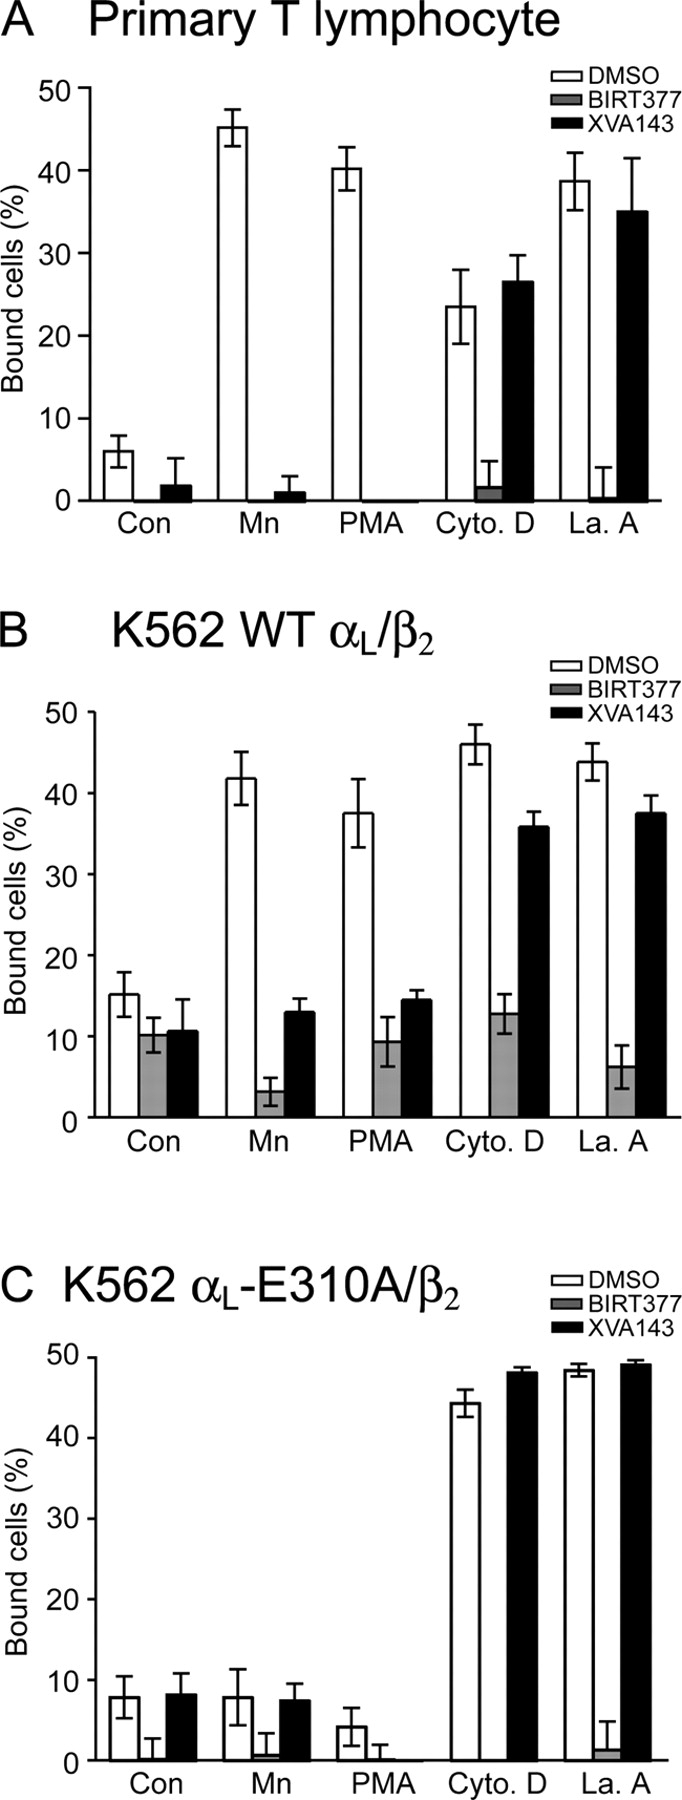
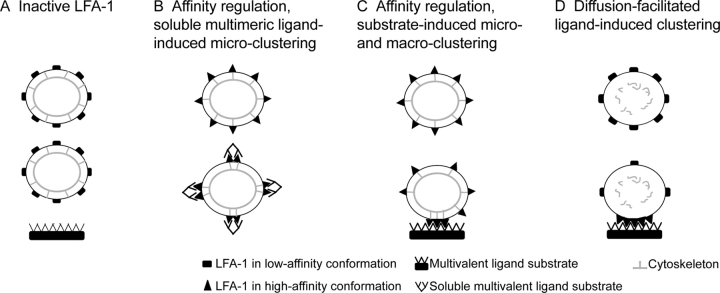
Dynamic regulation of integrin adhesiveness is required for immune cell-cell interactions and leukocyte migration. Here, we investigate the relationship between cell adhesion and integrin microclustering as measured by fluorescence resonance energy transfer, and macroclustering as measured by high resolution fluorescence microscopy. Stimuli that activate adhesion through leukocyte function-associated molecule-1 (LFA-1) failed to alter clustering of LFA-1 in the absence of ligand. Binding of monomeric intercellular adhesion molecule-1 (ICAM-1) induced profound changes in the conformation of LFA-1 but did not alter clustering, whereas binding of ICAM-1 oligomers induced significant microclustering. Increased diffusivity in the membrane by cytoskeleton-disrupting agents was sufficient to drive adhesion in the absence of affinity modulation and was associated with a greater accumulation of LFA-1 to the zone of adhesion, but redistribution did not precede cell adhesion. Disruption of conformational communication within the extracellular domain of LFA-1 blocked adhesion stimulated by affinity-modulating agents, but not adhesion stimulated by cytoskeleton-disrupting agents. Thus, LFA-1 clustering does not precede ligand binding, and instead functions in adhesion strengthening after binding to multivalent ligands.


Figures

Figure 1.
Figure 1.
Experimental design and validation of inter-heterodimer FRET microclustering assay. (A) A hypothetical model (Li et al., 2003) for integrin clustering. Cells expressing heterodimers with either the α (shown) or β subunits tagged with both mCFP and mYFP will exhibit FRET only when heterodimers are brought into close proximity (< 100 Å). (B) Schematic (top) and model curves (bottom) for FRET behavior under nonclustered and microclustered conditions (Kenworthy et al., 2000; Zacharias et al., 2002). See Results. (C–G) Inter-heterodimer FRET and acceptor intensities for individual ROIs from K562 cells expressing αL-mCFP/β2 and αL-mYFP/β2 (C and E), αL-CFP/β2 and αL-YFP/β2 (D), or αL2-mCFP and αL2-mYFP (F and G) were fit to formula image (red curves) using the Lineweaver-Burke equation as described in Materials and methods. Where indicated, cell surface LFA-1 was cross-linked by preincubation with either 10 μg/ml of TS2/4 mAb to αL (E) or CBR LFA-1/7 mAb to β2 (G) and secondary, purified goat anti–mouse antibody (10 μg/ml) for 30 min at 37°C. Representative confocal images, depicting the YFP signal from selected experiments (C–E), are shown below the graphs.
Figure 2.
Figure 2.
Multimeric ligand binding to activated LFA-1 but not activation alone induces LFA-1 microclustering. K562 cells expressing αL-mCFP/β2 and αL-mYFP/β2 (A), αL2-mCFP and αL2-mYFP (B), or αL-mCFP/β2 and αL-mYFP/β2 + CXCR4 (C) were preincubated with either 1 mM Mn2+, 1 mM Mn2+ + 100 μg/ml sIC-1, IC-Fc/Anti-IgA complex, 1 mM Mn2+ + IC-Fc/Anti-IgA complex, 1 μg/ml SDF-1, 1 μg/ml SDF-1 + 500 μg/ml sIC-1, or 1 μg/ml SDF-1 + IC-Fc/Anti-IgA complex, and were subjected to FRET measurements.
Figure 3.
Figure 3.
Disruption of cytoskeletal constraints enhances cell adhesion but does not promote soluble ligand binding or conformational change. (A and B) K562 transfectants expressing wild-type αLβ2 were preincubated with Mn2+, PMA, cytochalasin D, or latrunculin A in the absence or presence of inhibitory αL mAb TS1/22 (10 μg/ml) and allowed to bind ICAM-1 immobilized on V-bottom (A) or flat-bottom (B) plates, as described in Materials and methods. Data represent mean ± SEM of all measurements from three independent experiments in duplicate (A) or three independent experiments in triplicate (B). (C and D) Stable K562 cell transfectants expressing wild-type αLβ2 were allowed to adhere, with (C) and without (D) an initial centrifugation, to coverslips coated with ICAM-1 in the absence (Control) or presence of 1 mM Mn2+ or 1 μM cytochalasin D for 30 min at 37°C under static conditions. Coverslips were transferred to a laminar flow chamber and cells were then detached by a shear regimen of 30 s each of 0, 2, 4, 8, 16, and 32 dyn/cm2. The number of cells remaining after each interval were counted. Values are mean ± SEM for three separate experiments. (E) Binding of soluble, multimeric ICAM-1-Fcα chimera/anti-IgA-FITC complex was conducted in the presence of Mn2+, PMA, cytochalasin D, or latrunculin A at 37°C and measured by flow cytometry. Data show mean ± SEM of three experiments, each in triplicate. (F) Binding of conformation-sensitive antibodies KIM127 and m24 in the absence or presence of Mn2+, PMA, cytochalasin D, or latrunculin A was measured by immunofluorescence flow cytometry. A representative of three separate experiments is shown.
Figure 4.
Figure 4.
Disruption of cytoskeletal constraints does not alter LFA-1 macroclustering. (A–D) K562 cells expressing wild-type αLβ2 were incubated in (A) L15 medium (control); (B) 1 mM Mn2+; (C) 1 μM PMA; or (D) 1 μM cytochalasin D for 30 min at 37°C. After fixation, cells were stained with Cy3-conjugated TS2/4 mAb. (E) Cells were incubated with Cy3-TS2/4 mAb (10 μg/ml) together with purified anti–mouse IgG (10 μg/ml) at 37°C for 30 min followed by fixation. All cells (A–E) were then plated on coverslips and subjected to confocal microscopy. Center panels depict a threefold magnification of the boxed regions shown in the left panels. Three-dimensional histograms of fluorescence intensity and cell surface distribution are shown in the right panels.
Figure 5.
Figure 5.
Disruption of cytoskeletal constraints does not alter LFA-1 microclustering. Inter-heterodimer FRET between αL-mCFP/β2 and αL-mYFP/β2 (A) or αL2-mCFP and αL2-mYFP (B) was measured after 1 μM PMA or 1 μM cytochalasin D pretreatment for 30 min at 37°C, as indicated.
Figure 6.
Figure 6.
Cytoskeleton disruption leads to accumulation of LFA-1 to the zone of ICAM-1 substrate contact. (A and B) Stable K562 cell transfectants expressing wild-type αLβ2 were allowed to adhere, with (A) and without (B) initial centrifugation, to coverslips coated with ICAM-1 or BSA in the absence (Control) or presence of 1 mM Mn2+, 1 μM PMA, or 1 μM cytochalasin D as indicated for 30 min at 37°C. Cells were then fixed and subjected to IRM (top left panels) and DIC (top right panels). The zone including all IRM contacts for each cell was outlined and the area calculated by OpenLab software (bottom panels). Each symbol represents one cell. Bar = mean. *, P < 0.01 vs. Mn2+-treated cells. (C) Cells were prepared as in A and then were additionally subjected to staining with mAbs CBR LFA-1/7-Cy3 to β2 and TS2/4-Cy3 to αL followed by anti–mouse IgG-Cy3 to maximize the fluorescent signal. Samples were then analyzed by serial sectioning (0.5 μm Z-step) confocal microscopy. Images represent either the top view of the three-dimensional image reconstruction for “All” of the sections, or individual sections taken from the “Middle” or “Bottom” (at the ICAM-1 substrate contact interface) planes. Fluorescence intensity of LFA-1 staining in the “Bottom” section was plotted in the three-dimensional histogram of “LFA-1 density”. The LFA-1 accumulation index (AI) was calculated as (total number of pixels in the contact area × mean intensity of those pixels)/(106). AI = mean ± SEM for nine cells. *, P < 0.01 vs. Mn2+-treated cells.
Figure 7.
Figure 7.
Homotypic cell aggregation promotes LFA-1 macro- and microclustering at the cell–cell contact interface. (A) K562 transfectants expressing wild-type αLβ2 in 1.5-ml microfuge tubes (106 cells in 100 μl L15 medium + 2 mg/ml glucose) were centrifuged at 200 g for 30 s and incubated in the absence (control) or presence of 1 mM Mn2+, 1 μM PMA, or 1 μM cytochalasin D for 1 h at 37°C, transferred to cell culture dishes, and imaged by phase-contrast microscopy using a 10× objective in the original experiment. (B) Transient αL-mCFP/β2 and αL-mYFP/β2 K562 transfectants were treated exactly as in A, and inter-heterodimer FRET was measured for homotypically adherent cells. DIC (top), CFP fluorescence after YFP bleaching (middle), and pixel-by-pixel FRET efficiency (from 0 [black] to 0.2 [red]) (bottom) are shown. (C and D) K562 transfectants stably expressing αL-mCFP/β2-mYFP and the talin head domain (Kim et al., 2003) were gently removed from culture flasks and either directly plated on cover glasses and imaged with YFP fluorescence (C) or micropipetted 5–10 times to obtain single suspensions, plated, and incubated for 10 min before imaging YFP fluorescence (D). (E) Aggregates of K562 transfectants expressing αL-mCFP/β2-mYFP and the talin head domain were dissociated as in D and immediately subjected to time-lapse fluorescence imaging at 37οC. (F) To observe the formation of macroclusters, cells treated as in D were allowed to reestablish homotypic cell–cell contacts during time-lapse fluorescence imaging. Images are from representative experiments. (See also Video 2 and Video 3, available at http://www.jcb.org/cgi/content/full/jcb.200404160/DC1).
Figure 8.
Figure 8.
Affinity regulation, but not valency regulation, depends on conformational communication within the extracellular domain of LFA-1 as shown with both primary T lymphocytes and K562 transfectants. V-bottom adhesion assays were with primary human T lymphocytes (A), or with K562 cells stably expressing either wild-type αLβ2 (B) or αL-E310A/β2 (C). T lymphocytes were preincubated with 1 mM Mn2+, 1 μM PMA, 1 nM cytochalasin D, or 100 nM latrunculin A, and K562 cells were preincubated with 1 mM Mn2+, 1 μM PMA, 1 μM cytochalasin D, or 1 μM latrunculin A. Assays were in the presence of 20 μM BIRT377, 1 μM XVA143, or an equivalent concentration of DMSO as control. Data are mean ± SEM of three experiments, each in duplicate or triplicate.
Figure 9.
Figure 9.
Schematic of integrin affinity, diffusivity, and clustering. Inside-out signaling alters integrin affinity and cytoskeletal disruption alters integrin diffusity. How these regulate binding to ligand and the consequences for micro- and macroclustering are shown. Note that the additional effect of integrin redistribution in polarized cells was not studied here and is not shown.

References

    1. Ballestrem, C., B. Hinz, B.A. Imhof, and B. Wehrle-Haller. 2001. Marching at the front and dragging behind: differential αVβ3-integrin turnover regulates focal adhesion behavior. J. Cell Biol. 155:1319–1332. - PMC - PubMed
    1. Bazzoni, G., and M.E. Hemler. 1998. Are changes in integrin affinity and conformation overemphasized? Trends Biochem. Sci. 23:30–34. - PubMed
    1. Beglova, N., S.C. Blacklow, J. Takagi, and T.A. Springer. 2002. Cysteine-rich module structure reveals a fulcrum for integrin rearrangement upon activation. Nat. Struct. Biol. 9:282–287. - PubMed
    1. Buensuceso, C., M. De Virgilio, and S.J. Shattil. 2003. Detection of integrin αIIbβ3 clustering in living cells. J. Biol. Chem. 278:15217–15224. - PubMed
    1. Carman, C.V., and T.A. Springer. 2003. Integrin avidity regulation: Are changes in affinity and conformation underemphasized? Curr. Opin. Cell Biol. 15:547–556. - PubMed

Publication types

MeSH terms

Substances