. 2005 Mar 1;563(Pt 2):569-82.
doi: 10.1113/jphysiol.2004.076927. Epub 2004 Dec 21.

GABA-mediated control of hypocretin- but not melanin-concentrating hormone-immunoreactive neurones during sleep in rats

Affiliations

GABA-mediated control of hypocretin- but not melanin-concentrating hormone-immunoreactive neurones during sleep in rats

Md Noor Alam et al. J Physiol. .

Abstract

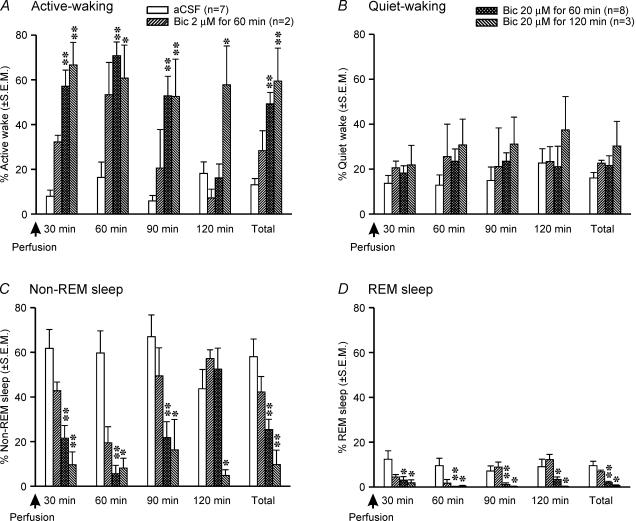
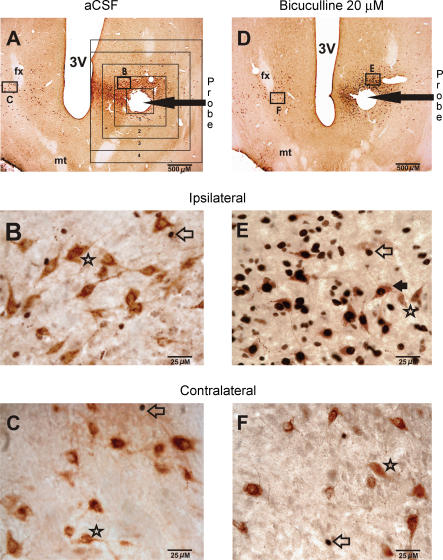
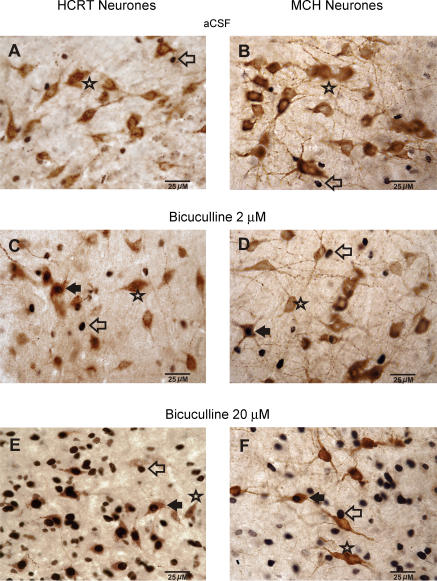
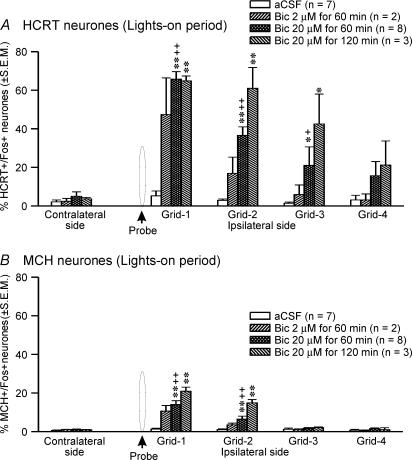
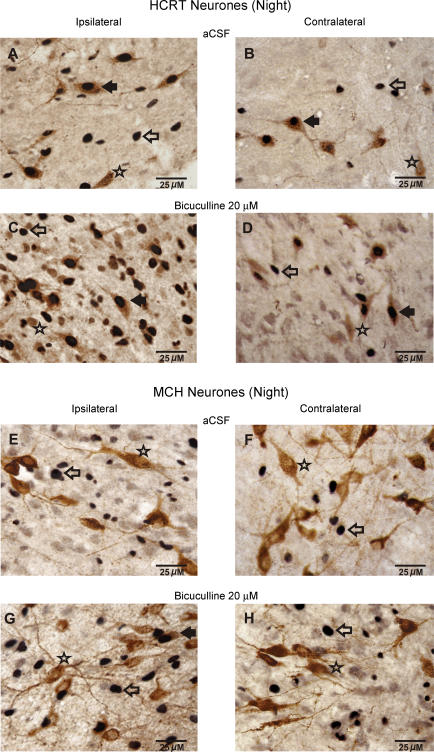
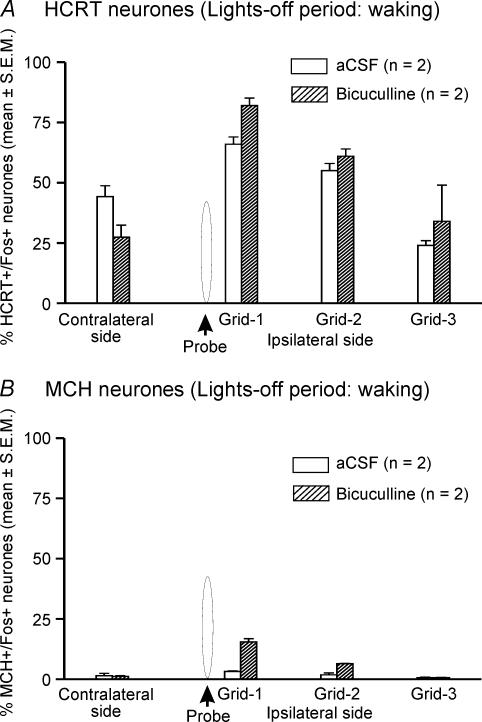
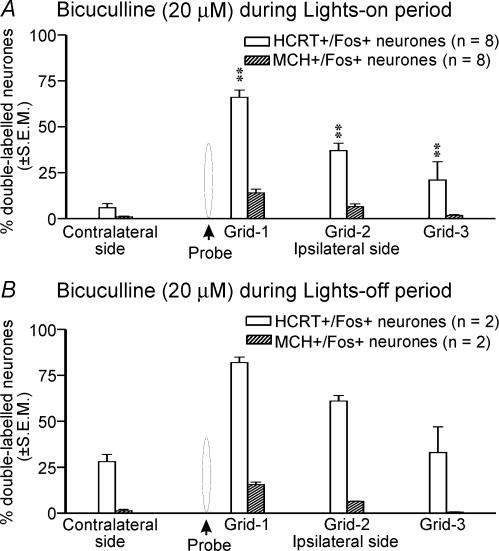
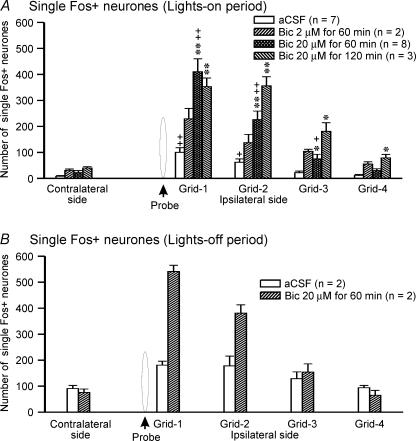
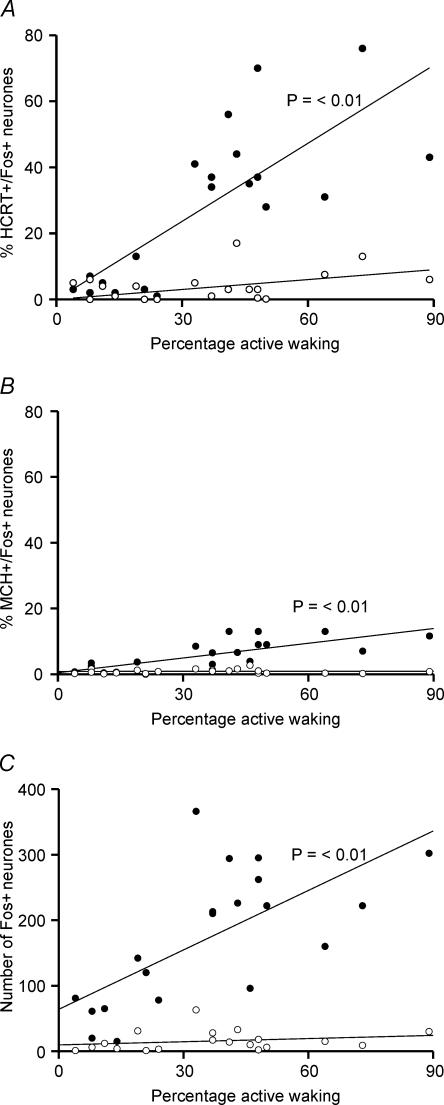
The perifornical-lateral hypothalamic area (PF-LHA) has been implicated in the regulation of behavioural arousal. The PF-LHA contains several cell types including neurones expressing the peptides, hypocretin (HCRT; also called orexin) and melanin-concentrating hormone (MCH). Evidence suggests that most of the PF-LHA neurones, including HCRT neurones, are active during waking and quiescent during non-rapid eye movement (non-NREM) sleep. The PF-LHA contains local GABAergic interneurones and also receives GABAergic inputs from sleep-promoting regions in the preoptic area of the hypothalamus. We hypothesized that increased GABA-mediated inhibition within PF-LHA contributes to the suppression of neuronal activity during non-REM sleep. EEG and EMG activity of rats were monitored for 2 h during microdialytic delivery of artificial cerebrospinal fluid (aCSF) or bicuculline, a GABAA receptor antagonist, into the PF-LHA in spontaneously sleeping rats during the lights-on period. At the end of aCSF or bicuculline perfusion, rats were killed and c-Fos immunoreactivity (Fos-IR) in HCRT, MCH and other PF-LHA neurones was quantified. In response to bicuculline perfusion into the PF-LHA, rats exhibited a dose-dependent decrease in non-REM and REM sleep time and an increase in time awake. The number of HCRT, MCH and non-HCRT/non-MCH neurones exhibiting Fos-IR adjacent to the microdialysis probe also increased dose-dependently in response to bicuculline. However, significantly fewer MCH neurones exhibited Fos-IR in response to bicuculline as compared to HCRT and other PF-LHA neurones. These results support the hypothesis that PF-LHA neurones, including HCRT neurones, are subject to increased endogenous GABAergic inhibition during sleep. In contrast, MCH neurones appear to be subject to weaker GABAergic control during sleep.


Figures

Figure 1
Figure 1. Effects of bicuculline on sleep–wake behaviour
Effects of aCSF and different doses of bicuculline microdialysed into the PF-LHA during the lights-on period (ZT5–ZT8) on sleep–wake behaviour of rats during the 2-h recording period before they were killed. As compared to aCSF treatment, bicuculline induced a significant increase in active waking (A), and suppressed both non-REM (C) and REM sleep (D). **P < 0.01; *P < 0.05 level of significance (independent t test).
Figure 2
Figure 2. Effects of bicuculline on Fos-IR in PF-LHA neurones
A, photomicrograph of a horizontal section (20 × magnification) from an animal that was perfused with aCSF and was awake for 17% of the recording time. The rectangular boxes around the probe tract show the grid system that was used for the quantification of Fos-IR neurones as a function of aCSF or bicuculline perfusion. The magnified images (400 x) of the marked sections on ipsilateral and contralateral sides are shown in B and C, respectively. In aCSF-treated animals, only a few Fos+ neurones were observed on both ipsilateral and contralateral sides and most of the HCRT+ neurones did not exhibit Fos-IR. D, example of a horizontal section (20 × magnification) showing the effects of bicuculline (20 μm for 60 min) on Fos-IR in PF-LHA neurones. This rat was awake for 58% of the recording time. The magnified images (400 x) of the marked sections on ipsilateral and contralateral sides are shown in E and F, respectively. In the presence of bicuculline, the number of both HCRT+ and non-HCRT neurones exhibiting Fos-IR increased dramatically. Filled arrow, HCRT+/Fos+ neurone; star, HCRT+/Fos– neurone; open arrow, single Fos+ neurone; fx, fornix; mt, mammillothalamic tract; 3V, third ventricle.
Figure 3
Figure 3. Bicuculline-induced dose-dependent changes in Fos-IR in PF-LHA neurones
Photomicrographs (400 x) showing the effects of aCSF and two doses of bicuculline on Fos-IR in HCRT+, MCH+, and non-HCRT/non-MCH neurones ipsilateral to the microdialysis probe during the lights-on period. A dose-dependent increase in Fos expression (black dots) can be seen in HCRT+, MCH+ and non-HCRT/non-MCH neurones. Filled arrow, HCRT+/Fos+ neurone or MCH+/Fos+ neurone; Star, HCRT+/Fos– or MCH+/Fos– neurone; open arrow, single Fos+ neurone.
Figure 4
Figure 4. Effects of bicuculline on percentage of HCRT+ and MCH+ neurones exhibiting Fos-IR
Mean percentage of HCRT+/Fos+ (A) and MCH+/Fos+ neurones (B) in different grids relative to the microdialysis probe after perfusion with aCSF or bicuculline during the lights-on period. The percentage of HCRT+/Fos+ or MCH+/Fos+ neurones on the contralateral side is the mean of neurones found in grids equivalent to the first three ipsilateral grids. In the presence of bicuculline, the number of HCRT+/Fos+ and MCH+/Fos+ neurones increased dose-dependently in a radius of 500–750 μm around the probe. *, as compared to the aCSF treatment (independent t test); +, as compared to the contralateral side (paired t test). ++,**P < 0.01; +,*P < 0.05 level of significance.
Figure 5
Figure 5. Effects of bicuculline on Fos-IR in PF-LHA neurones during the lights-off period
Photomicrographs (400 x) showing Fos-IR in neurones found ipsilateral and contralateral to the microdialysis probe after aCSF or bicuculline (20 μm for 60 min) perfusion during the lights-off period. Filled arrow, HCRT+/Fos+ or MCH+/Fos+ neurone; star, HCRT+/Fos– or MCH+/Fos– neurone; open arrow, single Fos+ neurone.
Figure 6
Figure 6. Effects of bicuculline on percentage of HCRT+ and MCH+ neurones exhibiting Fos-IR
Mean percentage of HCRT+/Fos+ (A) and MCH+/Fos+ neurones (B) after aCSF or bicuculline perfusion during waking in the lights-off period. Other details are the same as Fig. 4.
Figure 7
Figure 7. Effects of bicuculline on Fos-IR in HCRT+versus MCH+ neurones
Effects of 20 μm bicuculline on mean percentage change in HCRT+/Fos+versus MCH+/Fos+ neurones during the lights-on period (A) and during waking in the lights-off (B) periods. The percentages of HCRT+/Fos+ or MCH+/Fos+ neurones on the contralateral side are the mean of neurones found in grids equivalent to the first three ipsilateral grids. **P < 0.01 level of significance (independent t test).
Figure 8
Figure 8. Effect of bicuculline on Fos-IR in non-HCRT and non-MCH neurones
Number of single Fos+ neurones on ipsilateral and contralateral sides of the microdilaysis probe after aCSF and bicuculline perfusion into the PF-LHA during the lights-on period (A) and in waking during the lights-off period (B). The number of Fos+ neurones on the contralateral side is the mean of neurones found in three grids equivalent to first three ipsilateral grids. *, as compared to the aCSF treatment (independent t test); +, as compared to the contralateral side (paired t test). ++,**P < 0.01; +,*P < 0.05 level of significance.
Figure 9
Figure 9. Regression functions and correlation between bicuculline-induced active waking and increase in Fos-IR
Regression lines and scatter plots of the percentage of HCRT+/Fos+ (A), MCH+/Fos+ (B) and the number of single Fos+ neurones (C) in the ipsilateral side (•) and the contralateral side (○) versus percentage active wake time during the 2-h recording period before the rats were killed. The bicuculline-induced Fos-IR in a different neuronal population ipsilateral to the microdialysis probe was positively correlated with the amount of active waking. No significant correlation was found for neurones on the contralateral side. The active–wake and Fos-IR data were pooled from all rats used in this study for aCSF and bicuculline treatments.

References

    1. Abrahamson EE, Moore RY. The posterior hypothalamic area: chemoarchitecture and afferent connections. Brain Res. 2001;889:1–22. 10.1016/S0006-8993(00)03015-8. - DOI - PubMed
    1. Alam MN, Gong H, Alam T, Jaganath R, McGinty D, Szymusiak R. Sleep-waking discharge patterns of neurons recorded in the rat perifornical lateral hypothalamic area. J Physiol. 2002;538:619–631. 10.1113/jphysiol.2001.012888. - DOI - PMC - PubMed
    1. Alam MN, Mallick BN. Differential acute influence of medial and lateral preoptic areas on sleep-wakefulness in freely moving rats. Brain Res. 1990;525:242–248. 10.1016/0006-8993(90)90870-H. - DOI - PubMed
    1. Backberg M, Ultenius C, Fritschy JM, Meister B. Cellular localization of GABA receptor alpha subunit immunoreactivity in the rat hypothalamus: relationship with neurones containing orexigenic or anorexigenic peptides. J Neuroendocrinol. 2004;16:589–604. - PubMed
    1. Baldo BA, Gual-Bonilla L, Sijapati K, Daniel RA, Landry CF, Kelley AE. Activation of a subpopulation of orexin/hypocretin-containing hypothalamic neurons by GABAA receptor-mediated inhibition of the nucleus accumbens shell, but not by exposure to a novel environment. Eur J Neurosci. 2004;19:376–386. - PubMed

Publication types

MeSH terms

LinkOut - more resources